Trading Crude With Bollinger Bands
Post on: 16 Март, 2015 No Comment

Learn How to Trade Oil Online With a $100,000 Demo Practice Account. Demo accounts are a great way to practice online trading in real market conditions without risking any money. Register Here and Start Trading Crude Oil Immediately!
Trading Crude With Bollinger Bands
Ongoing conflicts in the Middle East and other regions of the world tend to cause widespread volatility in the crude oil trading markets. Major events related to the member nations of the Organization of Petroleum Exporting Countries (OPEC) usually have an immediate effect on crude oil prices on the New York Mercantile Exchange (NYMEX) and other major commodities markets around the world.
Examples of major events that have historically influenced crude oil prices include the Persian Gulf War of the early 1990s and the Arab Spring. These are examples of major geopolitical events; however, crude oil is also sensitive to climate conditions and natural disasters.
Prices may wildly fluctuate as a tropical storm increases in intensity and approaches offshore drilling rigs or heavily populated areas. Harsh winters and overlong summers may have a particularly strong effect on crude oil pricing as well.

The situations described above are proof that investing and trading in crude oil are economic activities subject to strong volatility caused by major developments. Although quite a few traders thrive and profit from volatile situations, they do not take a position on the market without first reading into the trends shown by the Bollinger bands.
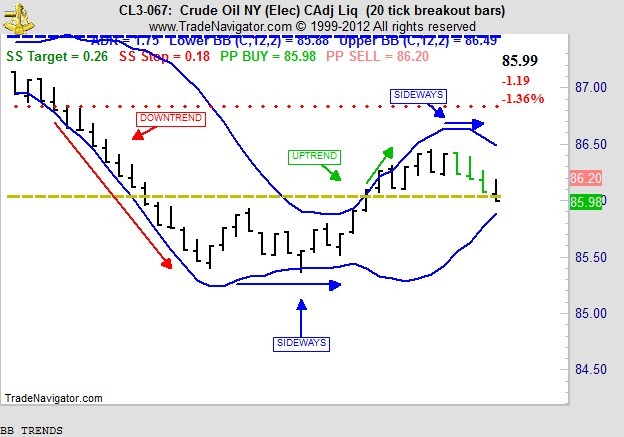
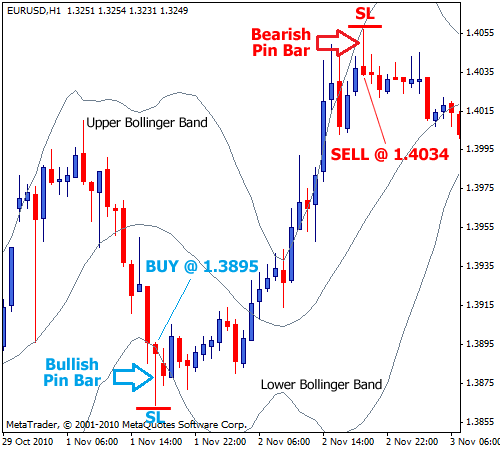
Bollinger bands are indicators used in technical analysis for the purpose of charting high and low prices. These bands indicate the high and low prices of investment vehicles and run parallel across the chart. In the case of WTI and Brent crude oil prices, for example, 30-day upper Bollinger bands can be used to find technical resistance around the simple moving average.
When traders look at Bollinger bands, they can interpret the formation of trends that they can formulate their trades around. Crude oil traders often place sell orders right around the price points indicated by the resistance bands on their charts during times of high volatility, such as during the most intense days of the Persian Gulf War. When this happens, it usually means that traders are planning exit strategies at a certain point when they expect a trend reversal is due to the movement of the bands.


