The HighYield BDC Portfolio Q3 2013
Post on: 16 Март, 2015 No Comment

This article is a follow up to The High-Yield BDC Portfolio from Q2 with updated allocations and investments for a BDC portfolio with an annual dividend yield of over 12% and the potential for capital gains. Currently, the five investments for the best high-yield BDC mix are Prospect Capital (NASDAQ:PSEC ), Medley Capital (NYSE:MCC ), TICC Capital (NASDAQ:TICC ), UBS 2X Leveraged Wells Fargo BDC (NYSEARCA:BDCL ) and Fifth Street Finance (NASDAQ:FSC ). In my article, A BDC Investment Philosophy And 4 Portfolios , I discussed what BDCs are and why I see them as good investments as well as four different approaches to investing in BDCs, taking into account various investor needs. Out of the 25 BDCs that I follow. I will pick five for each portfolio type (with the exception of the general portfolio) along with recommended weightings. The four types of portfolios that I will cover are:
The High-Yield Portfolio
This portfolio is for investors that are willing to take on a little more risk with less capital appreciation, but higher dividend yields. The following allocations for a high-yield BDC portfolio are used for the remainder of the information in this article, and all metrics are weighted accordingly. Investors who want a slightly less risky portfolio with a higher-than-average yield can adjust the weightings higher for MCC, and lower for BDCL, but reducing the overall dividend yield.
(click to enlarge)
These are the five general criteria I use to evaluate BDCs followed by my most recent BDC ranking table. I have included the High-Yield Portfolio as a group in the chart indicating how a portfolio with my recommended weighting would compare to the other BDCs.
- Profitability (EPS to cover dividends, NAV and EPS growth)
- Risk (rate sensitivity, diversification, portfolio quality, volatility)
- Payout (sustainable, consistent, growing)
- Analyst Opinions
- Valuation (NAV, P/E, PEG)
(click to enlarge)
UBS 2X Leveraged Wells Fargo BDC
BDCL or UBS ETRACS 2X Leveraged Long Wells Fargo Business Development Company ETN is an ETN based on the Wells Fargo Business Development Company Index. There are many issues with investing exchange traded funds such as capitalization and liquidity limits as well as tracking fees. There is also the added risk of 2X leverage, roughly equating to double the gains or losses in the BDC index but this is what pays the 15.3% yield. The top six holdings account for over 50% of the fund as shown in the chart below:
With such a high-yield, investors who are willing to take on extra risk may find BDCL to be an attractive investment. But with an industry as volatile as BDCs, most investors may not want the exposure of 2x leverage. The chart below shows a year to date chart of BDCL compared to the 25 BDCs that I follow:
Profit
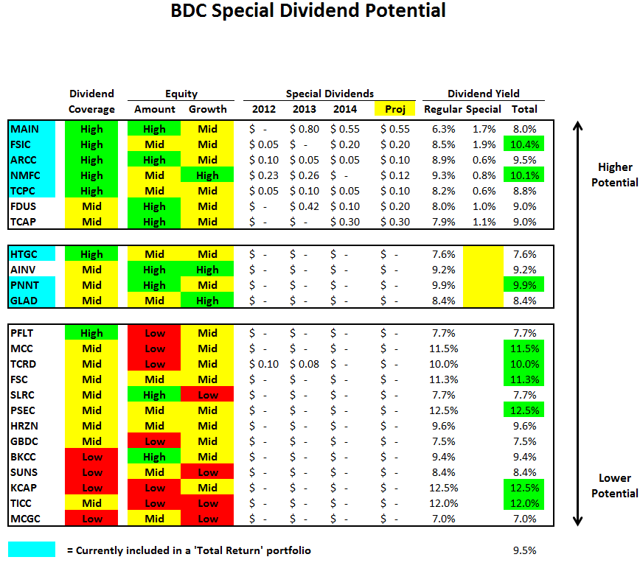
When evaluating high-yield investments, it is important to understand if the dividends are sustainable, ideally through net investment income (NII) and special dividends covered by realized capital gains. All of these BDCs have been actively raising capital through debt and equity offerings, making it difficult to normalize EPS to get a run rate of expected NII per share. In many cases, there are timing differences between the capital raised from issuing shares and the amount of income received from deploying that capital. The result is quarter-to-quarter variances and a potential temporary lack of coverage of dividends from NII, especially with FSC which is why it has the lowest allocation in this portfolio.
(click to enlarge)
Ultimately, these companies should be able to sufficiently cover dividends with NII. PSEC announced the following: We intend to continue earning net investment income that covers and provides the opportunity to increase our dividends. Our objective is to increase net investment income and dividends over time by expanding prudent leverage, increasing our mix of higher yielding originations, and from time to time making accretive acquisitions.
It is also important to watch for NAV stability to indicate if the value per share is stable after paying its high dividends. Historically, all of these BDCs have had NAV per share growth or stability.
FSC’s dividend is the only one that is potentially at risk for being cut but most likely this will not happen until 2014 and I will continue to monitor for signs and update this portfolio accordingly.

Risk
Along with high-yield BDCs comes higher risk. Some investors believe that perhaps they are just underpriced, and that might be true some of the time. But, in general, the market has a way of pricing things efficiently — especially in the case of BDCs with large amounts of institutional investors who own over $12 billion, or almost half of the industry, and often have teams of analysts as well as access to corporate and market data that most retail investors do not. In a recent series of articles. I covered the risk profiles of 25 BDCs. The following is a chart showing the most recent relative risk ranking with a weighted average rank of 5.8 for the high-yield portfolio (a rank of 10 implies the least amount of risk). Again, investors looking for less risk should adjust allocations accordingly.
Recently, the Fed’s comments pushed up the yield on the 10-year Treasury note to the highest level in almost two years. In my article BDC Risk Profiles: Part 6 — Interest Rate Sensitivity I focused on the interest rate sensitivity for BDCs considering fixed vs. variable rate investments compared to the amounts borrowed to fund those investments. The high-yield portfolio has a weighted average 68% of debt investments with variable rates and is higher than the average BDC with 61%. Higher yield BDCs tend to use higher amounts leverage giving this portfolio a debt-to-equity ratio of 0.67 compared to the average of 0.58:
I believe that most BDCs will benefit from rising interest rates given the high amounts variable rate investments and fixed-rate borrowings. In a recent statement from PSEC, the CFO stated: Prospect has locked in a ladder of fixed rate liabilities extending 30 years into the future, while most of Prospect’s loans float with LIBOR, providing upside to shareholders as interest rates rise.
Payout
Obviously, this portfolio has a higher than average dividend yield at 12.1% compare to the current average of 9.1%. At this point I would not expect to see much growth in dividends paid, with the exception of MCC.
Analysts
Analysts have relatively higher opinions for most of these BDCs with the exception of PSEC and TICC with average expectations. Target prices for the group are around 10% higher than current levels, indicating potential upside in stock prices.
Valuation
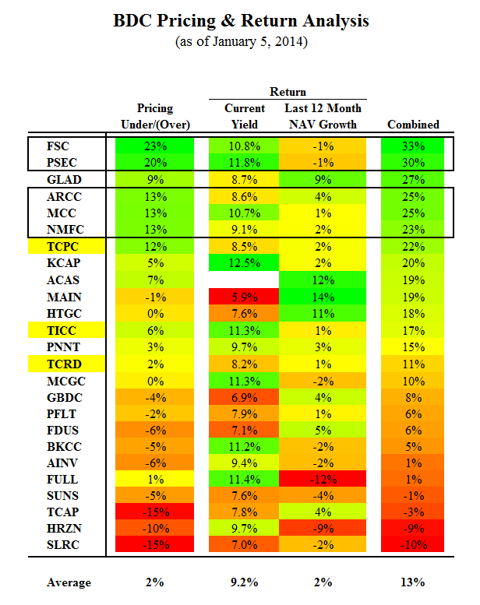
Ideally, each BDC would be priced along a valuation curve with investors paying a premium for favorable risk-to-reward ratios. Below is a table using my relative risk ranking to categorize each BDC into valuation levels and appropriate multiples of NAV, LTM EPS and 2013 EPS, but does not include the NAV multiple for ACAS due to it being an outlier in many respects and uses a normalized LTM EPS for PSEC (adjusted for the Gas Solutions sale):
As you can see, PSEC, MCC, TICC, and FSC are all priced lower than the average BDC contributing to their currently higher yields. My price targets for these four BDCs are around 16% higher than their current prices .
Summary
In a healthy market, riskier BDCs such as TICC and PSEC usually payoff especially with higher yielding investments like CLOs. When TICC’s CFO was asked about the recent purchase of a distressed investment that added to the non-accruals for the quarter, the CFO replied. prior to making our first CLO investment, we haven’t made any CLO investments and then when we did make one, then we made a few more and it’s actually become an incredibly profitable segment of our business. I’m not saying that, that’s going to happen here. I’m just saying that we are opportunistic debt investors and this was a good opportunity.
For high-yield-oriented investors, I believe this is a solid portfolio with a dividend yield of over 12% and the potential for capital gains. I would expect a short-term sell-off if interest rates spike and other yield investors move on to other types of investments. This could be a buying opportunity for long-term investors who continue to watch the underlying fundamentals of these investments. I will provide updates for this portfolio as needed (especially for FSC), including shortly after each quarterly earnings release, with updated allocations or overall changes. I would not recommend enrolling in a dividend reinvestment plan (unless it is with the individual company at discounted prices) but use the proceeds to fine tune allocations each quarter.
Investors should only use this information as a starting point for due diligence. See the following for more information:
Disclosure: I am long PSEC. I wrote this article myself, and it expresses my own opinions. I am not receiving compensation for it (other than from Seeking Alpha). I have no business relationship with any company whose stock is mentioned in this article.


