Technical Analysis Fundamental V
Post on: 16 Март, 2015 No Comment

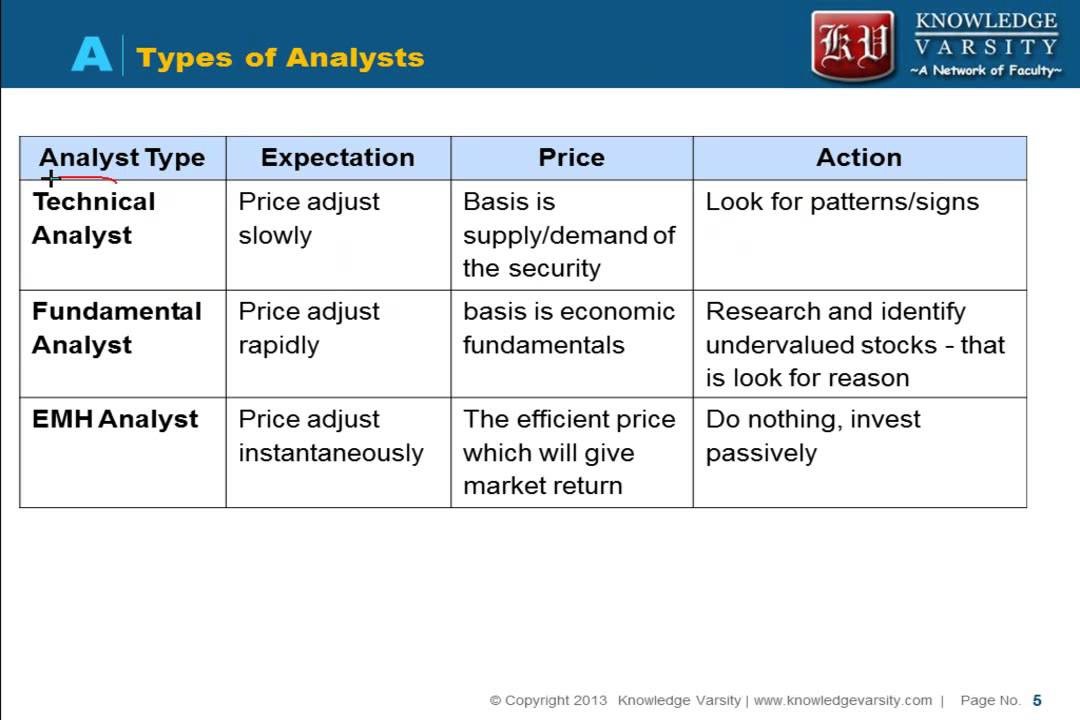
We begin our review of technical analysis by first acknowledging the distinct differences between fundamental and technical analysis. Fundamental analysis deals with factors that affect supply of or demand for a commodity. This approach is only concerned with the laws of supply and demand and the gathering of as much information as possible in a particular market to try and ascertain future price movement. Strict fundamentalists would be likely to dismiss the concept that you can predict future price movement from just looking at charts. And any success one might have using a charting approach is just a consequence of the laws of probability, since even a totally random trade selection process would yield of percentage of winners. It would be interesting to note, however, that charts can be a very useful tool to the fundamental analyst. Long-term price charts enable the fundamentalist to quickly isolate the periods of major price moves. By determining the fundamental conditions or events that were peculiar to those periods, the fundamentalist can identify the key price-influencing factors. This information can then be used to construct a price behavior mode.
Technical analysis, on the other hand, is concerned primarily with price action and trying to identify patterns that repeat themselves. Technicians accept that fundamental supply/demand considerations ultimately determine the value of a commodity, but they believe that price at any one point in time represents a consensus of value to all market participants, from large commercial interests to small speculators, or fundamental researchers to technical traders. The key premise of the technical trader is that past price behavior can be used to forecast future price behavior. The great increase in technically based commodity trading the past decade generally is credited to the computer, which can easily discern price tendencies or patterns that would have been difficult or impossible to identify by hand. Proponents cite several advantages of technical trading. For one, it eliminates the onerous task of trying to understand the various fundamentals of all the markets one might wish to trade. Technically based trading systems also can provide more objective buy/sell decisions, as long as the trader or researcher avoids interjecting his own subjective analysis into his computer output.
Regardless of your approach to the markets, it is of utmost importance to recognize why markets exist in the first place. The ultimate function of any market is to provide a mechanism for price discovery. In theory, a marketplace in an organized, formal setting should provide enough liquidity that every price level is traded. All participants would have equal access to all information and equal access to the price discovery process. Because prices are determined by the participants themselves, the market is merely a reflection of the human response to new information and to the ever present influence of the human characteristics of fear and greed.
The bottom line is that each trader must evaluate chart analysis independently and draw his own conclusions. However, many very successful traders consider charts to be an extremely valuable trading tool. The list below addresses some of the benefits of using charts, many of which are valid even if one totally rejects the possibility that charts can be used to forecast prices.
- Charts provide a concise price history-an essential item of information for any trader.
- Charts can provide the trader with a good sense of the market’s volatility-an important consideration in assess risk.
- Charts can be used as a timing tool, even by traders who formulate their trading decision on the basis of other information (e.g. fundamentals).
- Charts can be used as a money management tool by helping to define meaningful and realistic stop points.
- Charts reflect market behavior that is subject to certain repetitive patterns. Given sufficient experience, some traders will uncover an innate ability to use charts successfully as a method of anticipating price moves.
- An understanding of chart concepts is probably an essential prerequisite for developing profitable technical trading systems.
- Cynic take notice: Under specific circumstances, a contrarian approach to classical chart signals can lead to very profitable trading opportunities.

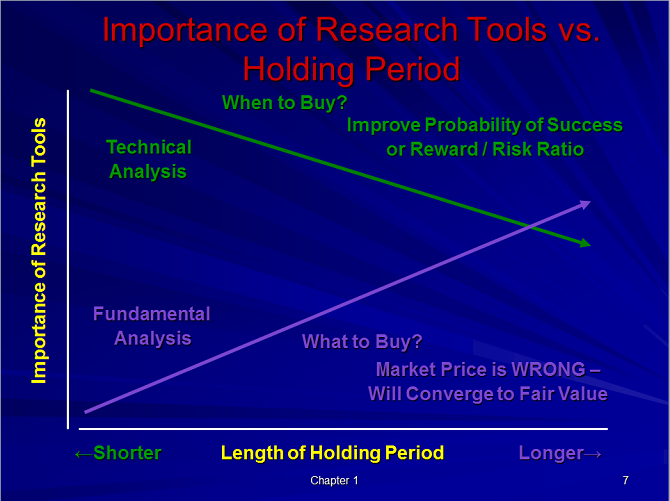
In summary, charts have something to offer everyone, from cynics to believers. Many market participants use a combination of fundamental and technical analysis. I, myself, have been full circle in determining what works best for me. I started out as a strict fundamentalist, subscribing to the theory that all the ships at the bottom of the ocean had a chart. However, I quickly realized that this was ignoring a very large (and growing) segment of traders, all of whom had an impact on market movement. Then I shifted my focus to primarily a technical approach, which posed problems as a broker because it can be difficult communicating with customers who aren’t familiar with the technical terminology. This approach eventually, too, became insufficient because all long-term market price direction is inevitably determined by supply/demand forces.
Finding the balance is the key for anyone, and I have become comfortable incorporating fundamental and technical analysis into a system that attempts to capture the best of both worlds. As a believer that economic forces ultimately control the direction of a market, my first step is to determine what those forces are and how they will affect the longer-term direction of the market. Thus, I use fundamental analysis to give me a long-term perspective on the market, and will focus the majority of my trade recommendations in that direction. I use technical analysis for timing of the trades for entry and exit, and how aggressive I want to be with that particular trade.
This booklet and presentation is designed to review and evaluate the key concepts of classical chart theory, as well as address the all-important question of how charts can be used as an effective trading tool. In other words, how can one make money using technical analysis.
Technical studies vary from the simple to the advanced, all with the goal of increasing the odds of trading success. Nonetheless, most analysts will agree the first place to start is with the most basic technical tools, many of which have been time tested to determine both their strengths and their weaknesses.


