Technical Analysis
Post on: 7 Июнь, 2015 No Comment

Technical Analysis — what on earth is it?
The day-to-day and week-to-week performance of companies in the share market depends on the underlying mood and sentiment of all the investors and traders who participate in the market. When a company’s share price rockets upward, or dives downward, it is because enough of the market participants have a strong enough view of the stock, or of the market generally, to cause the share price to move.
Don’t believe it?
Somewhat sceptical about the idea that there are stories in the price charts that are left behind by the market participants? See the chart at right and consider the following observations (click on chart for a larger version with more details and comments).
In this price chart, we can see that in late 2013 there were no buyers of CBA shares who thought the stock was worth more than $80. When the price rose this high in October 2013, sellers stepped in to take profits. [ie. the opinion of market participants was that CBA was not worth $80.] The $80 level was a resistance level.
This caused the price to fall away, but trade mostly higher than about $73. So the $73 price level was a floor (or support level) for the price. And for the next few months it traded no higher than $78. [ie. the opinion of market participants was that CBA was worth between $73 and $78 — no lower and no higher.]
This was the case until April 2014 when buyers started falling over each other to buy the stock. This caused the price to push above the $80 level, and keep rising in a strong uptrend. [ie. the opinion of market participants was that CBA was now worth more than $80.]
Weekly price chart of CBA
from October 2013 to May 2014.
The opinion of market participants
is captured in the price charts.
Not convinced? See some supporting materials that provide evidence.
Why is it so?
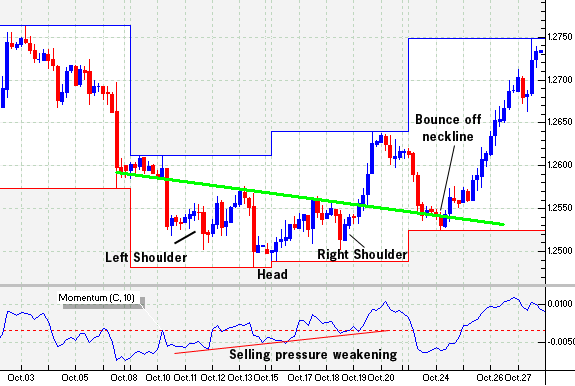
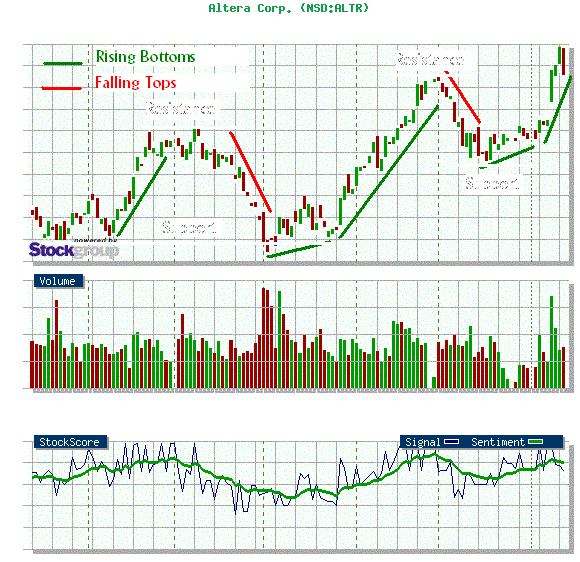
It is the underlying emotions of fear, greed and hope which drive share prices (often based on fundamental data or news stories), all of which are reflected in the share price charts. The underlying sentiment is reflected in the price charts, and in the volume bars on the chart, and in the relative height of candlesticks on a candle chart, and the presence and length of tails on the individual candlesticks. And successive days or weeks of price movement can form patterns on the chart which also reflect the underlying market sentiment.

(typically on share price charts)
to try to gauge likely future price action.
The field of Technical Analysis is the study and interpretation of the price action of financial instruments (eg. shares, currencies, commodities, bonds, etc.) and the statistical prediction of their future behaviour. In Technical Analysis there is a substantial body of knowledge ranging from simple price charts to complex mathematical and computer studies.
For some tips and guidance to help you get started with utilising technical analysis. see Robert’s
4 Windows approach which provides a great check list, as well as an introduction to a number of key aspects of technical analysis .
In it’s purest form, the application of technical analysis can involve no consideration of Fundamental Analysis ; but the two approaches can be combined — eg. in the Funda-Technical Analysis approach.
People who use technical analysis might invest in shares in the share market, or in currencies (forex), or options, warrants, commodities or other sorts of financial instruments. Thousands of people around the world use this to successfully time the market. Nothing is 100% perfect, but when coupled with the right approach, strategy and money management and risk management methods, one can be very successful and profitable.


