Support and Resistance examples
Post on: 16 Март, 2015 No Comment

A lot of technical analyst recommend to use a weekly chart first to mark your support and resistance zones. However, over time and with practice you will find that daily charts with 12 months of historical should be sufficient to find your support and resistance zones.
It is very simple to spot support lines (this area is where there is buying pressure). Remember that we are looking for at least to points where the price has touch the existing trend. There are only 3 possible trend direction in any market these are horizontal, ascending or descending.
So why do we use this support and resistance lines? Remember, that we use technical analysis to project future share price. A line is drawn along these points and are extended forward to project a future price target for a particular stock or share.
Let me give you some real life example of Support lines so you can identify them.
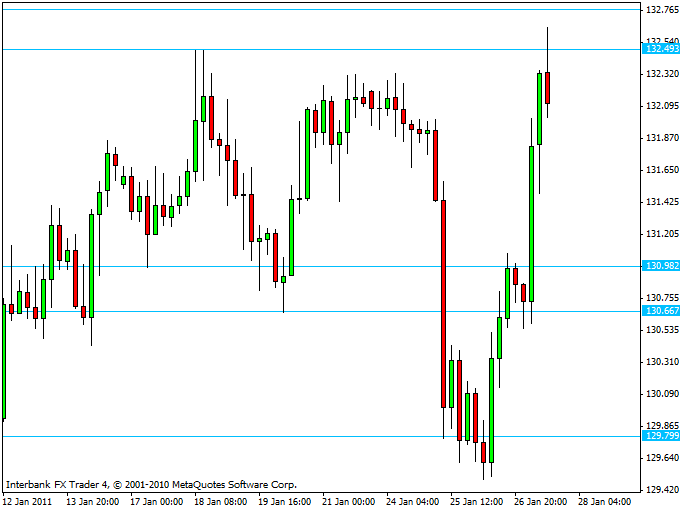
In the chart above you will notice how easy it is to spot support zones. Again this are identified by at least two points bouncing back almost at the same price. Have a look at where we have placed the red line for you.
There are many trends found with the same chart. Let us show you how you can identify an uptrend support line.
If you look at the chart above had you drawn and projected forward the first to points in September you could almost guess what would happen when the share price touches the uptrend line in Decemember 2006. It sure did bounce, almost like an electric shock. Bzzzzz
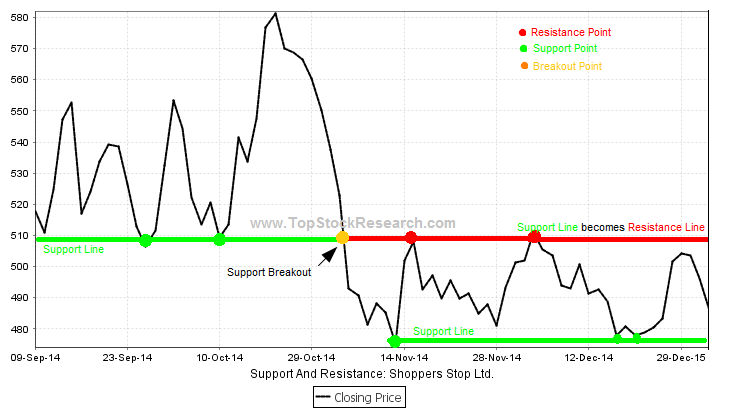
So what happens when the price breaks through the support line. This is such a popular question. Well the answer is very simple, often when the price breaks support lines, the old support becomes new resistance.

This can sometimes be confusing for new traders to understand. As always though it is best to provid you with real life chart examples.
This is an example where horizontal support was broken. As soon as it breaks the old support becomes resistance. In the short term as soon as the price broke the $6.60 price to the down side as the share price bounce back up $6.60 is now the new immediate resistance.
On the next example, the blue circle illustrates support as the stock price bounces of the downward trend line. When the stock price breaks through the support line (red circle), this now becomes new resistance on the way up (Green circle). I really do hope you get the idea here.


