Renko Charts Trade Ticker
Post on: 16 Март, 2015 No Comment

Renko Charts
Brief History
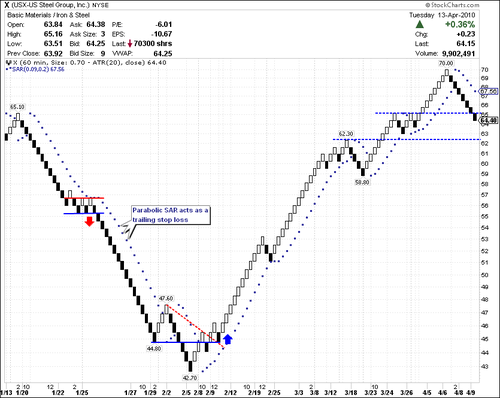
The Renko style of charting was developed by the Japanese.The objective was to create a method of charting that only considered price movement; therefore, Renko bars do not include time or volume. The Japanese word for brick is “renga” and is thought to be the origin of the word Renko since the bars look much like bricks. The Renko charts are constructed by placing a new bar or “brick” in the next column once the price surpasses the top or the bottom of the previous brick by predetermined tick setting, defined by the trader. Typically, when the market is trending up the brick is white.Conversely, when the market is trending down the brick is colored black, (Trade Navigator allows the user to customize the brick color under the edit chart settings). Renko charts can be very effective at identifying support and resistance levels and other chart patterns used with time based bars. Renko bricks have also been compared to Point and Figure charts, however, the Renko charts are seen as tidier and much easier to follow.
Renko Settings
Much like a range bar (Trade Navigator: Breakout Bar), Renko charts are based off of the movement of price. It is key to getting the correct settings for the market. For example, if a trader would like to see a new brick once the ES market has move one point or four ticks the Renko setting would be 4. Trade Navigator has also added an option that allows the trader to select either ticks or points. In this example the setting is #Ticks. If a trader chooses #Points than the setting for our ES example would be 1. For some markets number of ticks proves to be more advantageous than number of points.An example would be Crude Oil (CL). For a smaller Renko brick a trader may select a 5 tick setting which represents .05 of price movement. Crude can be a faster moving market and can turn on a dime; therefore, larger tick settings are appropriate for this market. Some traders have found that using a percentage of the Average True Range of the market helps as a starting point for the Renko bar setting. This percentage can range from 5% to 20% depending on how many bricks the trader is comfortable with.
There are many ways to trade the Renko charts; therefore it is important for a trader to find the right style for them. One of the most popular ways to trade the Renko charts is to wait for the market to break out of a sideways or range bound area. This will show a top level of resistance and a lower level of support. Once the market has reached the horizontal style channel traders should look for a break of the upper or lower levels for an entry. This theory is no different than a channel break on a line chart or time based chart. Applying Keltner Channels (Trade Navigator: Keltner Channel) of an appropriate set number of bars to the chart will help to visually see when the market is in a sideways range. The Keltner Channels work better for the Renko bars than the Bollinger Bands do in this case. When day trading Renko bars the Keltner Channels must be set to an appropriate setting. In this example the Keltner Channel is set to 12 bars used in the average and a factor of 2. (For more information see Keltner Channels)
Long Break Out Example
A new trend that is emerging to be popular with some groups is using the Renko bars with the Commodity Channel Index or CCI. The majority of the CCI movement is between +100 and -100. In this case when the CCI is below -100 regions, traders may identify an oversold area and look for a bullish move. Conversely, when the CCI is above +100, traders may look for an over bought area and look for a bearish move. Using the seven bar exponential moving average with the CCI can be very helpful at times when looking to catch larger moves in the market. An investor can identify an overbought or oversold signal on the CCI then wait for the Renko bar to cross over the seven bar exponential moving average for an entry. A more conservative approach to this would be to wait until the CCI crosses back over the zero level for an entry.Here are some examples of overbought and oversold markets using CCI.
Overbought Example
Oversold Example
As many traders look for an advantage in the market they often apply two or more indicators together to help spot investing opportunities. In this case Keltner Channels and the CCI have been added to the charts. Traders can look for the CCI to be above the +100 level and for the Renko bars to be breaking above the Keltner Channels for a long opportunity. On the short side, investors look for the CCI to be below -100 and the Renko bars to be below the Keltner Channels. This gives the trader an opportunity to look for break outs along with overbought and oversold areas simultaneously. When the market is in a sideways range investors can identify overbought and oversold conditions on the CCI and wait for the market to bounce from one band to the next. In the first two examples, traders are looking for the over bought and oversold conditions and jumping in with the trend instead of fading the markets like in example three.
Long Keltner Channels & CCI Example
Short Keltner Channels & CCI Example
Reversing Keltner Channels & CCI Example
The Renko bars can be a very helpful tool for an investor making tough trading decisions. Normally, Renko bars are best used for trading breakouts, but they can also be used during range bound markets. The best trends that fit the Renko bars are those that have breakout moves outside of the Keltner Channels with a CCI confirmation.

Remember, when looking at overbought and oversold, identify the CCI and either wait for the Renko bars to cross the exponential moving average or the CCI to cross the zero level. During the larger trends trade in the direction of the established trends with the CCI above +100 or below -100.
Like all technical indicators, it is important to use the Renko bars with other technical indicators. This could be Volume, Pivot Points, Support and Resistance, and so forth. Using other technical indicators will help confirm or refute the signals given by the Renko bars by themselves.
To apply the Renko bars on to your charts go to the top toolbar where it shows the time setting on your chart. Click the delta arrow and scroll to the very end of the list and select “
If you wish to change the bar coloring right click on the chart and select the top option “Edit Chart Settings.” Under Pane 1: Price you will find the first option is Price, select that option, but do not click the check mark. On the right hand side you will see Color, the Renko bars closing higher will have this color. Check the box next to Use Up/Down Colors to change the Renko bars closing lower. As you can see below I have changed the bars closing higher to Green and the bars closing lower to Red.
To add the Keltner Channels to your charts press the letterA on your keyboard. This will bring up the “Add to Chart” window. Under the Studies tab you will find the Keltner Channels, click on that study and then click Add.
To add the CCI to your charts press the letter A on your keyboard. This will bring up the “Add to Chart” window. Under the Indicators Tab you will find CCI, click on that indicator and then click Add.
For more information on how to pilot your Trade Navigator Charts please feel free to contact our support team either by email or phone.
Phone: 719-884-0245
Check out whats new by visiting us at www.TradeNavigator.com


