Preparing For Bull Or Bear Market Using Low Correlated ETFs
Post on: 27 Май, 2015 No Comment

Summary
- Finding low correlated ETFs.
- Balancing return and risk.
- Ranking of fundamental ETFs.
With the stock market bouncing around all-time highs, but not showing much in the way of direction, what is a reasonable approach to rebalancing a portfolio other than sticking with a Strategic Asset Allocation (SAA) plan as shown below.
ETF Dashboard: The following screenshot is the asset allocation plan for a moderately aggressive portfolio. Eighty percent (80%) of the portfolio is allocated to equity investments and twenty percent (20%) is divided among U.S. and International Bonds.
A tilt toward value is apparent if one looks at the nine asset classes in the upper left-hand section of the Dashboard. Asset classes with a white background are the target percentages and the colored background shows that actual percentages held in the portfolio. Gold and Commodities are under target as PowerShares DB Commodity Index Tracking ETF (NYSEARCA:DBC ), our commodity holding, is under-performing iShares 1-3 Year Treasury Bond ETF (NYSEARCA:SHY ) and SPDR Gold Trust ETF (NYSEARCA:GLD ) was underperforming until recently.
One model for portfolio management is to follow a SAA model that meets the needs of the individual investor and then keep the asset classes within target. Another model is one where we look for low correlated ETFs and focus investments on a few of the top performers as explained below.
ETF Rankings: The first step in what I will call the Cluster Model is to come up with a list of securities that have a high probability of pairing low correlated ETFs. By using ETFs we diversify across the globe with as few as 15 to 30 securities. In the following example, 29 ETFs and one stock are selected. Berkshire Hathaway (NYSE:BRK.B ) is the stock and it can be viewed as a well managed mutual fund.

ETFs are ranked based on three metrics. Fifty percent (50%) is allocated to the best performers over the most recent 91 calendar days, 30% to the best performers over the most recent 182 calendar days, and 20% to volatility, where low volatility is highly valued.
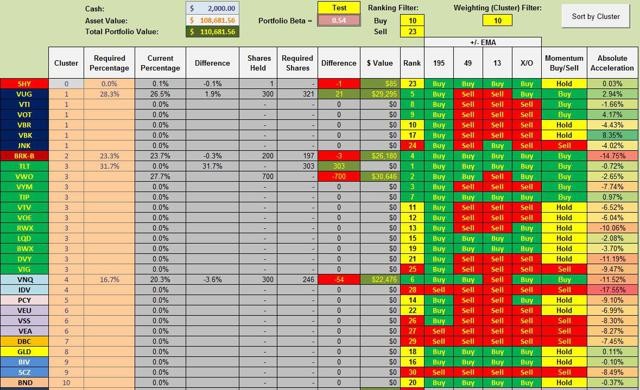
To reduce portfolio risk, securities performing below SHY are trimmed from the portfolio. Seven ETFs currently fall into that elimination zone.
Rather than investing in the top performing ETFs, we run all the ETFs through a correlation screen and break the 30 securities into ten clusters where the correlations are generally 0.70 or below. Those clusters are identified by color in the left-hand column in the third screenshot.
Cluster Recommendations: The cluster screening software permits one to set a weighting screen. In the following table, the filter was set to 10 and this ended up identifying three ETFs and one stock, Berkshire Hathaway, for purchase. Back-testing of this process shows the best performance occurs when the portfolio is narrowed to four securities, provided all are performing above SHY. SHY is the cutoff ETF, so securities performing below SHY are sold out of the portfolio.
To reduce turnover, there are times when two ETFs are highly correlated and it makes no sense to sell one and purchase a similar ETF based on correlation data. Check iShares 20+ Year Treasury Bond ETF (NYSEARCA:TLT ), a treasury, and Vanguard FTSE Emerging Markets ETF (NYSEARCA:VWO ), an emerging market ETF, in the following table. TLT is the top ranked security and VWO is number two. Both are found in the same cluster (#3). The table shows this portfolio holds 700 shares of VWO and zero of TLT. Since they are closely correlated as well as ranked #1 and #2, one would hold VWO and wait for the next review period to see that happens to TLT.
Both TLT and VWO can be purchased commission free so if there are other reasons, such as tax benefits, then make the move.
The Cluster Model reduces risk by keeping the investor out of ETFs or stocks that are performing below SHY based on three performance metrics. Securities that are showing positive momentum are favored for investment. Portfolios are reviewed every 33 days, but one can extend that time to every quarter and not suffer falloff in returns.
This model of portfolio management continues to undergo testing. If a bear market strikes and no ETFs are performing above SHY, we go to cash or invest in SHY. If the bull market continues, we are invested in the ETFs that are driving the market upward.
Disclosure: The author is long VTI, VNQ, RWX, TLT, VUG, VEA, VWO, PCY, BRK.B. The author wrote this article themselves, and it expresses their own opinions. The author is not receiving compensation for it (other than from Seeking Alpha). The author has no business relationship with any company whose stock is mentioned in this article.
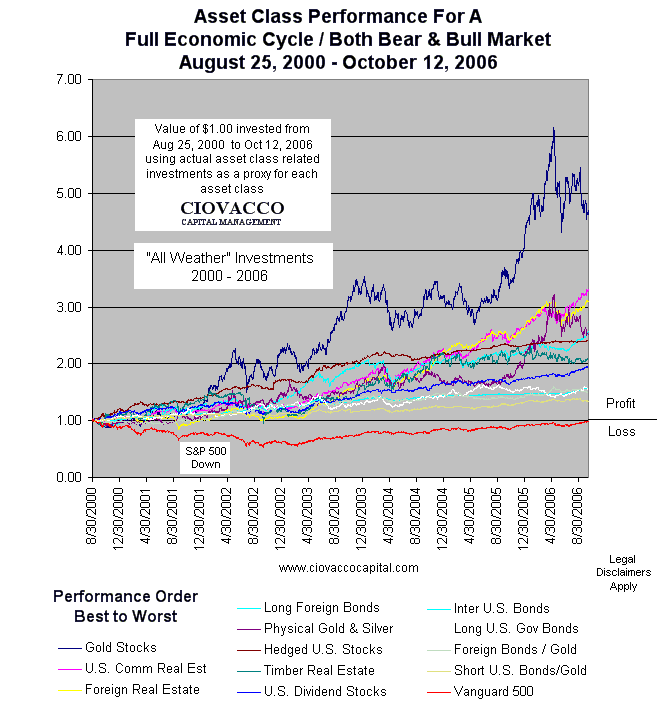
Additional disclosure: I hold or have held all of the ETFs list in the second slide.


