Observations Interest Rate Forecast for 5Year Treasury Notes
Post on: 12 Август, 2015 No Comment

Saturday, July 21, 2012
Interest Rate Forecast for 5-Year Treasury Notes
In this post, we forecast the yields for five-year treasury notes/bonds over the next five years using the same technique we used in an earlier post. In the earlier post, Where Are Interest Rates Headed?. we used the current yield curve to derive the yield curve as it is expected to be one, two and five years in the future. In effect, this post takes the results from that post and looks at them through a different lens.
Market Forecast of Five-Year Interest Rates for Next 5 Years
Market Forecast of Five-Year Interest Rates
In the graph above (click to expand) the solid blue line represents five-year U.S. Treasury Notes. Year zero shows the current yield of 0.68% (To be consistent with the graph in the previous post, current is as of June 15, 2012). The remaining points show the expected yield on five-year treasuries from one to five years in the future. The expected yields were derived from
the yield curve as of June 15, and using the techniques described in Where Are Interest Rates Headed? .
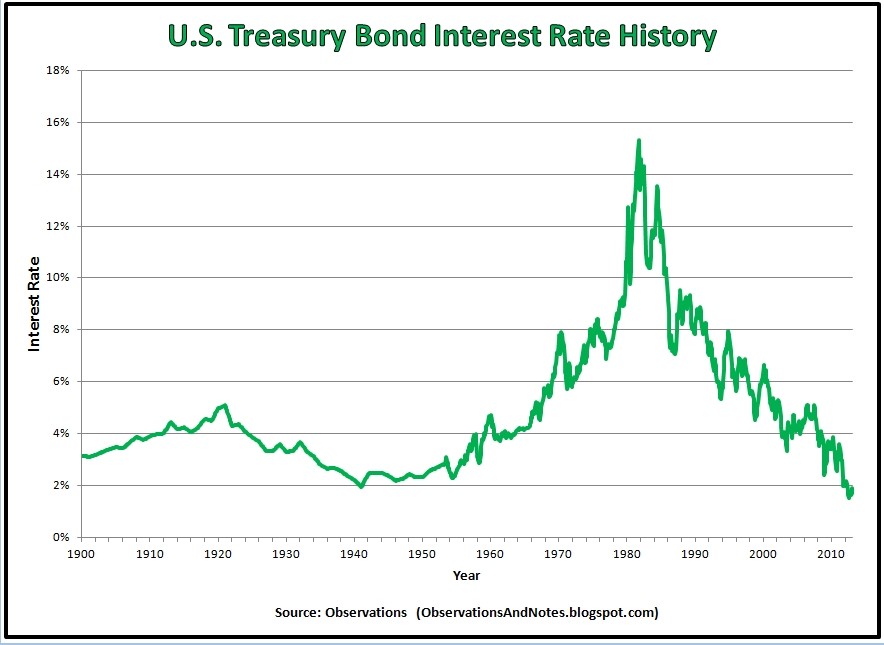
As you can see from the chart, the market is expecting five-year rates to rise gradually from the current near-record low of 0.68% — ending the five-year period at around 2.5%. Those are still unusually low rates — certainly based upon our experience in the last 50 years.
For reference, the dotted line represents the equivalent results for one-year U.S. Treasury Bills. They are calculated to end the five-year period at about 1.8%. Again, those are unusually low rates, though perhaps not quite as historically low as the forecast five-year rates.
Should I Buy 5-10 Year Treasuries Now, or Wait?
The prospects for five-year treasuries are of special interest; it’s one of the most popular maturities. An important question for many retirees is whether to buy them now, or wait. Should I hold my nose and tie my money up for 5-10 years at record or near-record low interest rates? Or, should I accept even lower shorter term interest rates in order to have greater liquidity when rates inevitably rise?
Somewhat surprisingly, the answer seems to be it doesn’t matter. According to my calculations, for any fixed period of time, say ten years, the expected ending amount is the same regardless of what combination of maturities you choose. That is, buying a ten year note results in the same ending amount as buying a five-year note and reinvesting the proceeds in another five-year note five years from now. Or, buying a three year note followed by a four and a another three. Or, a four year note followed by three consecutive two-year notes. (Interested readers can download the spreadsheet and conduct their own experiments.)
If you think about it carefully, this result follows from the way we calculated the future yields. Still, it always seems magical.
The Advantage of Bond Ladders
Of course, if you’re laddering your bonds the decision on when to invest is made for you automatically. More on that in a later post.
For More Up-to-Date Interest Rate Forecasts
Note: I update this graph very infrequently. For the most recent forecast of 1 and 5-year rates five years from now, see the March 2013 market update. For an even more up-to-date, and more encompassing, forecast you can download the yield curve forecasting spreadsheet and input current yield curve data from the Treasury.
Note: calculations assume no taxes or commissions.
Related Materials
Where Are Interest Rates Headed?. The original post that introduces this methodology
100 Years of Interest Rate History. A graphic history of U.S. interest rates.

Daily Treasury Yield Curve Rates. the Department of the Treasury’s constant maturity series. Updated daily. Enter current data from this site into the interest rate forecast spreadsheet to get an updated forecast.
Barron’s U.S. Treasury Notes & Bonds Listing. Allows more accurate estimate of interest rates for maturities not covered in the treasury constant maturity series (e.g. treasuries maturing in 4 years or 8 years). Updated weekly.
Five-Year Treasury Note Yield History. The U.S. Government DGS5 series. Five-year yields since around 1962.
One-Year Treasury Bill Yield History. The U.S. Government DGS1 series. Yields since around 1962.
Al’s Interest Rate Forecast Model/ Spreadsheet. My spreadsheet that derives future yield curves/ interest rates from the current yield curve.
The 10-Year Stock Market Projection. My methodology for projecting future stock market returns.
For lists of other popular posts by subject area, see the sidebar to the left or the blog header at the top of the page.
Share This Article
Bookmark this on Delicious To share via Facebook, Twitter, etc. see below.


