Momentum Relative Strength Asymmetry Observations
Post on: 22 Июнь, 2015 No Comment

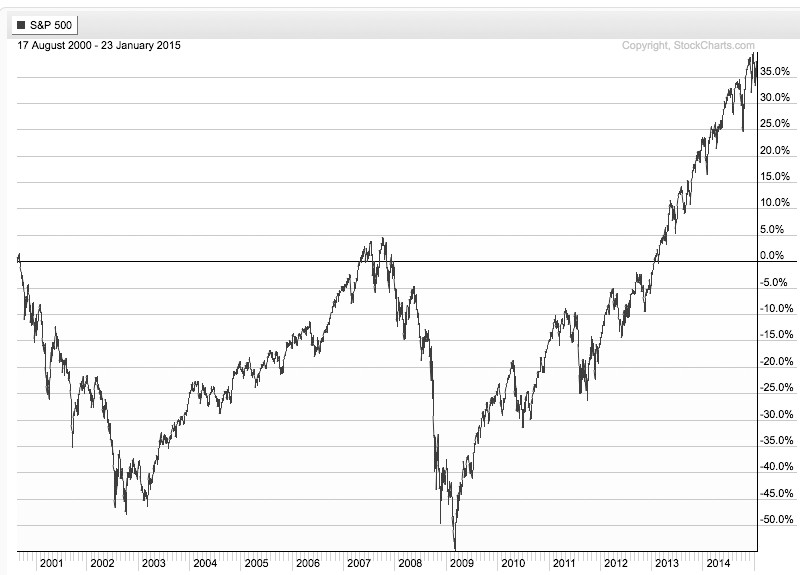
That was the lesson you learned the last time stocks became overvalued and the stock market entered into a bear market.
In a Kiplinger article by Fred W. Frailey interviewed Mohamed El-Erian, the PIMCOs boss, (PIMCO is one of the largest mutual fund companies in the world) he says he tells how to reduce risk and reap rewards in a fast-changing world. This article Shaking up the Investment Mix was written in March 2009, which turned out the be the low of the global market collapse.
It is useful to revisit such writing and thoughts, especially since the U.S. stock market has since been overall rising for 5 years and 10 months. Its one of the longest uptrends recorded and the S&P 500 stock index is well in overvalued territory at 27 times EPS. At the same time, bonds have also been rising in value, which could change quickly when rates eventually rise. At this stage of a trend, asset allocation investors could need a reminder. I cant think of a better one that this:
Why are you telling investors they need to diversify differently these days?
The traditional approach to diversification, which served us very well, went like this: Adopt a diversified portfolio, be disciplined about rebalancing the asset mix, own very well-defined types of asset classes and favor the home team because the minute you invest outside the U.S. you take on additional risk. A typical mix would then be 60% stocks and 40% bonds, and most of the stocks would be part of Standard & Poors 500-stock index.
This approach is fatigued for several reasons. First of all, diversification alone is no longer sufficient to temper risk. In the past year, we saw virtually every asset class hammered. You need something more to manage risk well.
But, you know, they say a picture is worth a thousand words.
Since we are talking about downside risk, something that is commonly hidden when only average returns are presented, below is a drawdown chart. I created the drawdown chart using YCharts which uses total return data and the % off high. The decline you see from late 2007 to 2010 is a dradown: its when the investment value is under water. Think of this like a lake. You can see how the average of the data wouldnt properly inform you of what happens in between.
First, I show PIMCOs own allocation fund: PALCX. Allianz Global Allocation Fund. I include an actively managed asset allocation that is very large and popular with $55 billion invested in it: MALOX. BlackRock Global Allocation. Since there are many who instead believe in passive indexing and allocation, I have also included DGSIX. DFA Global Allocation 60/40 and VBINX. Vanguard Balanced Fund. As you can see, they have all done about the same thing. They declined about -30% to -40% from October 2007 to March 2009. They also declined up to -15% in 2011.
ycharts.com/ drawn by Mike Shell

Going forward, the next bear market may be very different. Historically, investors consider bond holdings to be a buffer or an anchor to a portfolio. When stock prices fall, bonds havent been falling nearly as much. To be sure, I show below a drawdown chart for the famous actively managed bond fund PIMCO Total Return and for the passive crowd I have included the Vanguard Total Bond Market fund. Keep in mind, about 40% of the allocation of the funds above are invested in bonds. As you see, bonds dropped about -5% to -7% in the past 10 years.
ycharts.com/ drawn by Mike Shell
You may have noticed the end of the chart is a drop of nearly -2%. Based on the past 10 years, thats just a minor decline. The trouble going forward is that interest rates have been in an overall downtrend for 30 years, so bond values have been rising. If you rely on bonds being a crutch, as on diversification alone, I agree with Mohamed El-Erian the Chief of the worlds largest bond manager:
diversification alone is no longer sufficient to temper risk. In the past year, we saw virtually every asset class hammered. You need something more to manage risk well.
But, dont wait until AFTER markets have fallen to believe it.
Instead, I apply active risk management and directional trend systems to a global universe of exchange traded securities (like ETFs). To see what that looks like, click: ASYMMETRY ® Managed Accounts


