How to Trade Renko Charts Brick by Brick
Post on: 16 Март, 2015 No Comment

Instructor, CMT
A common complaint from traders is that they seem to exit from profitable trades too soon. They find that fear grips them and they find they could have made much more money if they only stayed in the trade longer. In our search for profits, we are often shaken out by the market’s noise.
What if there was a way to chart that minimizes the effect of that market noise and could filter out small corrections while still giving you the ability to see reversals that could put your profits in jeopardy? Well you are in luck because there is such a tool. It is known as a Renko chart and today well investigate how to trade Renko charts.
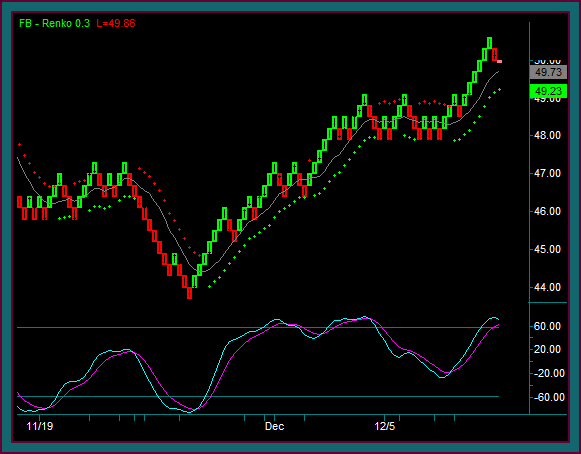
Renko (derived from the Japanese word “renga” or brick), is based on movements in price and not time. There must be a particular size of movement or the chart ignores it. Since time is not a factor for Renko charts, it may be a technique that should be used for swing or position traders rather than for intraday traders.
The only parameter that must be determined for the Renko chart is the size of the brick itself. The larger the size, the less movement a chart will show but there will be larger stops on the positions. If you use too small of a brick size, you will have too much sensitivity to price movement and the reason for using the Renko chart is lost. While there is no perfect setting, traders will often use 1% of the price of the stock as the setting on daily Renko charts. You need to experiment yourself and see which number offers you the best view of the trend.
Renko bricks are drawn at 45 degree angles from each other and are based on the closing price per period. If you have a brick setting of 5 dollars and the stock price closes 23 dollars higher, five bricks would be added to the chart. Another brick would only be added if you were to have a new close another two dollars higher. For there to be a brick created in the opposite direction, you would need prices to reverse and close at least two times the size of the brick. If price does not do this, then any correction will be ignored by the chart.
The advantages of the Renko chart can outweigh the disadvantages. However you should be aware of what those disadvantages are. First, these charts are price based and time is ignored. There could be a long period before a new brick is created. Using a daily close for these charts could mean there may be several days or even weeks before price moves significantly enough to create a new brick. With intraday Renko, there may be hours between brick creation. A trader must be very patient in this case as the trend has paused and become choppy.

Since there is no reversal shown until a new brick could be drawn in the opposite direction, the stops could be quite large. Of course making the brick size smaller can tighten the stops but as I mentioned, this comes at the expense of price sensitivity.
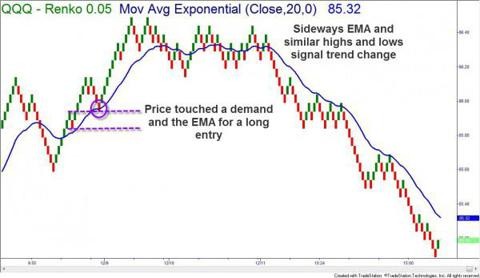
Trends can be seen much easier when using these types of charts. Supply and demand zones also seem to be more visible. When trading, always trade in the direction of the dominant trend. You can stay in the trade until your next target is reached or when you have a sign of reversal which would be a brick in the opposite direction.
You can try experimenting with trades based on Renko charts to see if you want to use them regularly in your trading repertoire. Next week I will discuss more advanced methods of Renko charting and how to incorporate technical indicators with them.


