How to Choose a Municipal Bond Fund
Post on: 1 Июнь, 2015 No Comment

There are over 2,000 municipal bond funds. however most people will invest in only 1 or 2. Here are some simple steps which will allow you to filter through all the options and chose the fund that’s right for you.
Step 1: State Specific Or National Municipal Bond Fund?
Residents of states with no income taxes (Florida, Texas, Nevada, Washington, Washington, Alaska, Wyoming, and South Dakota) should chose a national bond fund. A national fund provides more diversification and potentially slightly higher yields than a state-specific fund (like a New York municipal bond fund, for example).
Larger states with high income taxes, such as New York and California, will have a selection of state specific funds. These funds will provide income that is free of state and local income taxes, in addition to being free of federal income taxes. You should choose a state specific fund if you live in one of these states.
Those in a smaller states like Rhode Island or North Dakota, may not have state specific funds available. Even if a state fund is available, there is compelling argument for choosing a national fund. Smaller states have economies dependent on one or two industries, so a state specific fund may not be able to provide real diversification of risk.
Step 2: Alternative Minimum Tax (AMT) Free or Not?
Many wealthy investors are subject to the Alternative Minimum Tax, or AMT for short. Funds that are not AMT Free, have the potential to pay a higher after-tax yield than funds that are AMT Free. However, this is not true if you are subject to AMT tax. Ask your accountant if you are likely to be subject to AMT tax. If you are subject to the Alternative Minimum Tax you should check with the Mutual Fund Company to see what exposure they have to bonds which are not AMT free. There are also specific funds that are prohibited from investing in bonds which are subject to the AMT tax which may be appropriate as well. They will normally have “AMT-Free” in their name.
If you don’t know if you are subject to the Alternative Minimum tax or would like to learn more about it go here .
Step 3: Passive or Active Municipal Bond Fund?
There are two types of municipal bond funds. Those that are passively managed which are also referred to as “Index Funds”, and those that are actively managed. The goal of a passively managed bond fund is to match the performance of an index as closely as possible. The goal of an actively managed bond fund is to beat the performance of an index.
If you are not sure which type of fund is right for your situation, read our article on passive vs. active bond funds .
Step 4: Municipal Bond Mutual Fund or ETF?
With the one big exception of PIMCO’s ETF (Ticker: BOND). the large majority of popular Bond ETFs are passively managed. With this in mind if you want an actively managed fund you are most likely going to need to go the bond mutual fund route.
If you have decided that passively managed funds are the best option read our article “Bond Mutual Funds vs. Bond ETFs ” to decide whether a Bond ETF or Bond Index Mutual fund is best for your situation.
Step 5: Decide How much Interest Rate Risk You Want to Take
Generally, the longer the bonds that your fund holds have until maturity. the higher the yield on the fund. However, what you trade for that higher yield is greater volatility as interest rates change. For how to decide how much interest rate risk you are willing to take, read our article on Bond Fund Interest Rate Risk .
Step 6: Decide how much credit risk you want to take
Credit risk is the likelihood that some of the bonds your fund invests in will default. The more credit risk a bond fund takes, the higher both its potential return and the volatility of those returns. The large majority of investors will want to steer clear of high yield municipal bond funds. and stick with investment grade funds only. For more on credit risk see our article on bond fund credit risk .
Step 7: Choose your category and setup your screen
This step is best explained with an example:
Let’s assume that I am a resident of Florida, so I do not pay state income tax. In the past, I have not had to pay AMT Tax and my income is not likely to be very different this year. I don’t have a strong view on interest rates and am willing to live with moderate volatility but, I don’t like financial rollercoasters.
Florida (no state income tax) -> National Municipal Bond Fund
No AMT Exposure -> Normal or AMT Free Bond Funds
Moderate Volatility Acceptable / No Interest Rate View -> Intermediate Bond Funds
No Financial Rollercoaster -> No To High Yield Municipal Bond Fund
Fund Choice -. Intermediate Term National bond Fund
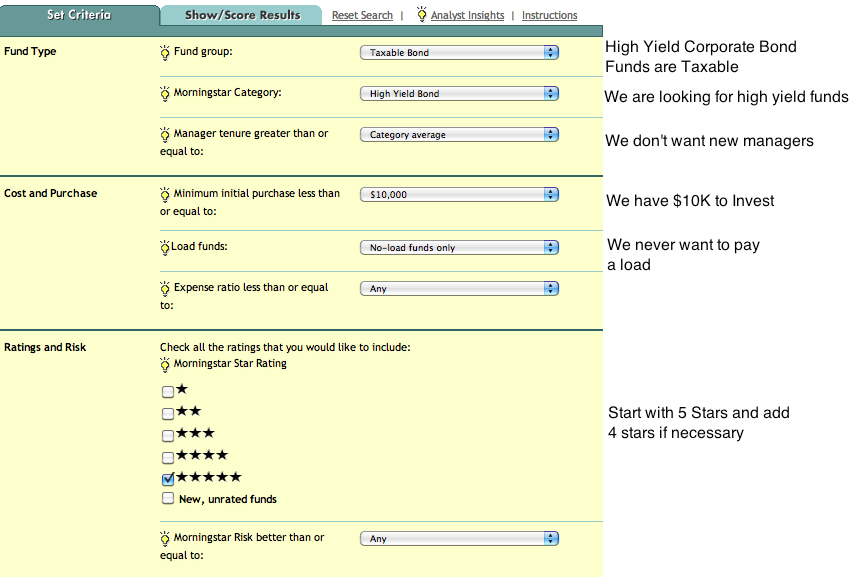
Once you picked your municipal bond fund category, you can create your mutual fund shortlist. We recommend using Morningstar.com’s free mutual fund screener which you will find here. While The screener provides many options, we will focus on a few key ones and leave the rest blank. In this instance here are the settings we would use:
For a full explanation of each of the sections and why we choose the settings we choose, see our article on setting up a bond mutual fund screener .
Step 8: Create your shortlist
Let’s fill out the form based on the previous example, a person interested in a municipal national bond. The results come back with the following 4 funds:
Step 9: Pick Your Fund
By clicking on the name of each fund you will be able to visit the quote page for each fund. On the quote page, there will be a symbol name. Write down the symbols for each of the funds, we will be using their symbols to compare returns.
Now goto the first fund’s quote page. Next click the “chart” tab at the top of the page, which brings you to a chart of the fund’s performance for the last 10 years. This chart also has the category average returns and fund’s benchmark plotted alongside the return of the fund on the chart. It looks like this:
Next remove the index and category lines from the chart by running your mouse over their names at the top of the chart and click the x that appears. I have highlighted where you do that with a red box in the image above.
This leaves you with just the performance of the fund on the chart and not other lines. Now enter the other three tickers symbols, one by one into the compare box above the chart. This will give you a chart showing the performance of all 4 funds on your short list for the last 10 years. It will look like this:
Its pretty clear from looking at this chart which fund has been the top performer, at least from a total return standpoint. The First Investors Tax Exempt II Load Waived Fund (blue line) has left me with $17,163.96 after 10 years which is around $1000 or 7% more than the lowest performing fund of the group.
As this was the top performing fund, lets have a look at its performance page by entering its ticker EIITX.lw in the quote box at the top of the page, which brings up the morningstar quote page for the fund below:
I have highlighted with red boxes the 4 areas that I am going to look at for each of the funds on my shortlist.
- Yield. First off is the yield of the fund. Morningstar uses the 12 month trailing yield which basically averages the yield of the fund over the last 12 months (you can learn more about this here). I see this is 3.49%. Once I bring up the pages of the other funds for comparison I will know whether this is good or bad relative to the other funds.

- Expense Ratio. The expense ratio however is over 1% which is higher than a lot of funds but lower than others. Where funds are yielding between 3 and 4% giving up 1% i means a large portion of the income the fund generate will go to paying expenses. It is important to note however that the fee has been included in the performance results.
- Risk. Moving down to the next box which gives an idea of the Risk of the fund vs. other funds in its category and the return. As we already know from looking at the chart comparison the fund has above average returns. What we did not know until now is that the fund is also taking a lot of risk to get those returns.
- Average Maturity. Looking at the next box we can see why, as with an average effective maturity of 8.77 years they are at the high end of the range for intermediate term bond funds. In other words if interest rates start to go up, this fund is likely to fall in value more than other funds in the same category.
What I like about this fund:
- It has the best total return of all the funds in my shortlist, over the last 10 years.
What I don’t Like about this fund:
- High expense ratio.
- It has above average risk for its category
- The average maturity of the bonds it is holding are at the high end of the range. It is taking a lot of interest rate risk.
Now lets have a look at the next fund on our list the Wells Fargo Advantage Fund SIMBX
What I like About this Fund:
- Lower expense Ratio than the first investors fund.
- Return is above average for the category
- It is taking an average amount of risk compared to the category to generate that above average return for the category..
- With an average effective maturity of 5.68 carries much lower interest rate risk than the First Investors Fund.
What I don’t Like about this fund:
- It has a low yield relative to other funds on my shortlist.
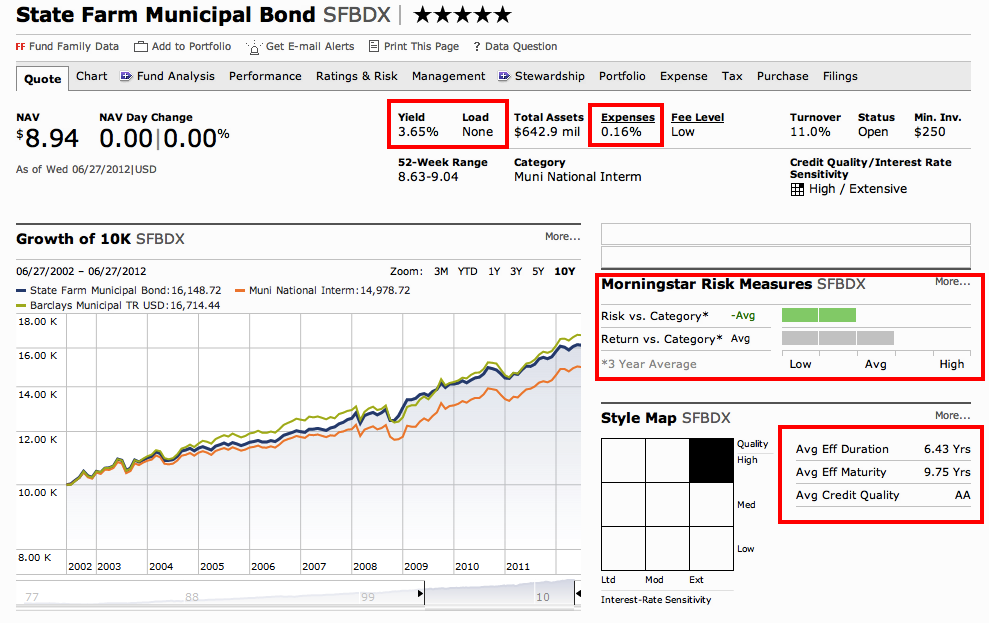
Next lets have a look at the State Farm Municipal Bond Fund Ticker SFBDX.
- Good Yield
- Very Low Expense Ratio
- Below Average Risk for an Average Return
What I don’t Like About this Fund:
- The average Effective Maturity of the bonds in the fund are on the high side.
Next Lets Look at the last fund on our list the USAA Tax Exempt Intermediate Term Ticker USATX.
- It has by far the best yield of all the funds on the list.
- Low Expenses
- Average Risk for Above Average Returns
- An average effective maturity of 4.46 years this fund should have the lowest interest rate risk of any of the funds listed.
What I don’t like about this fund:
The fact that there is nothing that I do not like about this fund + my concern over rising interest rates + the fact that this fund has the least sensitivity to interest rates of the funds listed makes it my choice.


