How the crash of safe assets fueled the financial crisis
Post on: 28 Май, 2015 No Comment

Getty Images
Traders on the floor of the NYSE on December 1, 2008.
Looking back now, the financial crisis and the deep recession that followed still appear mysterious.
How was it that an uptick in mortgage defaults led to a situation where 12 of the 13 most important financial institutions in the U.S. were near failure, where millions of American were thrown out of their jobs, and from which the economy still apparently bears deep scars?
Gary Gorton, a Yale University professor, has described the crisis as the result of a loss of confidence in bank debt. In a handful of very influential papers, Gorton has described the important role of ‘safe assets’ in the economy and how assets can become unsafe.
As part of his project, Gorton has assembled a large database of so-called safe assets. He divides safe assets into two broad categories:government-issued liabilities and financial sector liabilities.
Government safe assets include Treasurys, municipal bonds, and debt issued by government-sponsored entities such as Fannie Mae and Freddie Mac. Financial sector liabilities include mortgage-backed securities, bank debt, and bank deposits. (For a full description, see the Appendix to Gorton’s paper Safe Asset Share. )
Of course, one of the things that happened in the financial crisis is that a lot of things that had been considered safe suddenly seemed no longer all that safe. It wasn’t so much that all the credits became impaired but that market participants began to worry about losses and could not easily calculate which securities would suffer.
As Gorton put it in his paper Collateral Crisis, debt instruments that had been information-insensitive became information-sensitive. They no longer could perform many of the functions that people used safe assets for.
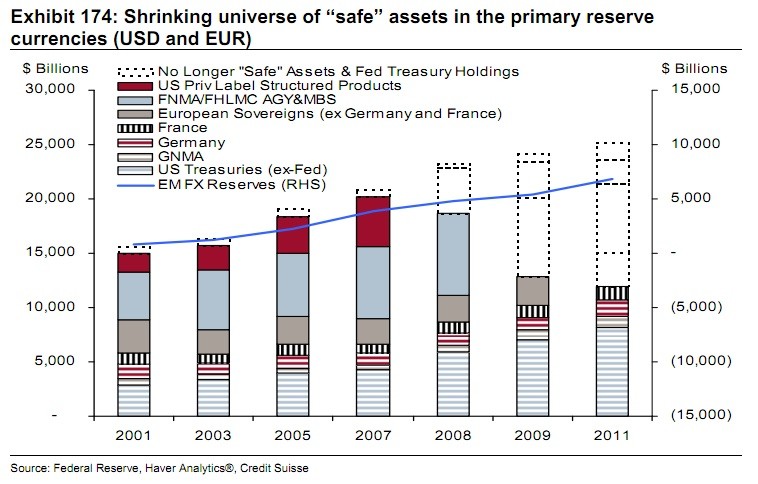
Using data obtained from Gorton, I decided to chart the phenomenon of assets suddenly becoming unsafe. The chart tracks safe assets as defined by Gorton from the first quarter of 2001 through the third quarter of 2011. But it makes several adjustments to take account of the financial crisis.
In August 2007, BNP Paribas froze three of their funds, saying they could no longer value the subprime collateralized debt obligations they owned. On Aug. 9, the European Central Bank and the Federal Reserve announced liquidity injections. I decided to use this as the start date of the crisis in mortgage-backed securities. So, in the chart, asset-backed securities are taken out of the category of safe assets. That’s the first step downward.
The next downward lurch comes from doubts about the financial liabilities of banks themselves. I take this out of the safe asset calculation starting in the first quarter of 2008, when Bear Stearns failed.
Next we have the crisis of Fannie Mae and Freddie Mac. This is the third leg down, in the third quarter of 2008. But they are added back in the fourth quarter of 2008 because they were taken into the custody of the federal government.
The big climb after that comes from the various programs aimed at injecting capital into banks, providing liquidity to the MBS market, and generally assuring the market that the most important financial institutions wouldn’t be allowed to fail.
The overall picture produced is one of a severe contraction of safe assets. What’s more, even once the panic has subsided, we do not return to the previous path of safe asset growth. Instead, there are several quarters of stagnation until growth returns again in 2011.
Without a doubt, some of the details in the chart can be disputed. It would be preferable to build it with more granular data. For example, it would be nice if I could subtract certain vintages of MBS rather than net out MBS in general. Some of the dates are arguable. The MBS crisis might actually be pushed back to the problems of the Bear Stearns hedge funds earlier in 2007. The Fannie and Freddie problems might be pushed back so that they last longer than a quarter.
To the extent that safe-assets perform money like functions for financial institutions, the crisis can be viewed as the result of a specialized type of monetary contraction. What made the crisis so severe and what made the Great Recession so deep, was the Great Contraction shown here.


