How profitable are the signals generated by Ichimoku Cloud charts
Post on: 16 Март, 2015 No Comment

The Cloud chart is a form of technical analysis developed in Japan which has spread in popularity so that it is now used in many countries outside of its native birthplace.
Cloud charts are also sometimes known as Ichimoku charts, and this article is predominantly an attempt to find out through rigorous back-testing how well this method is at generating reliable trading signals.
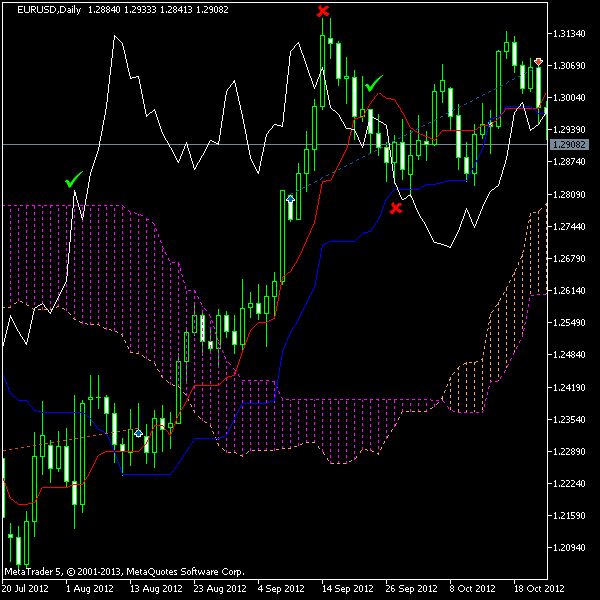
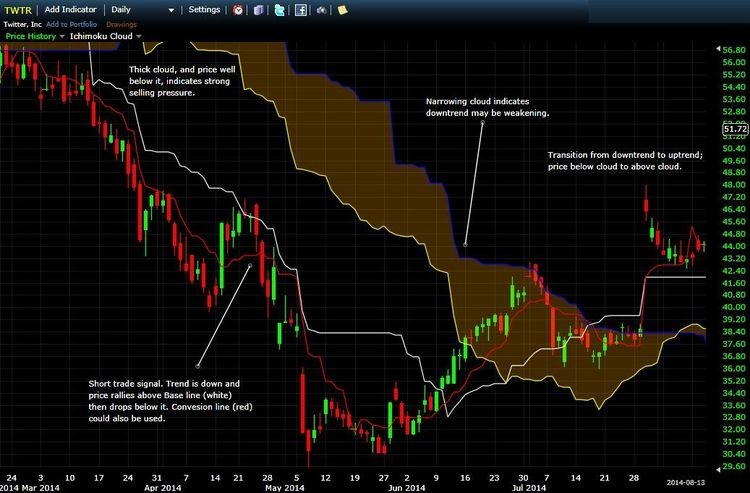
For those unfamiliar with Cloud charts the diagram below shows an example with all the major characteristics labelled with their names. The main elements are the cloud and the short and long moving averages which are called Tenkan Sen and Kijun Sen.
The cloud is the most important constituent of the chart and it is interpreted as follows: when the price of the security is above the cloud then it I said to be in an ‘uptrend’, when it is below the cloud it is said to be in a ‘downtrend’. When it is inside the cloud it is said to not be trending at all.
The Tenkan and Kijun sen lines are used to give buy and sell signals when they cross each other in the way that western moving average cross-overs do. The lagging line or Chinkou span is used as a gauge of support and resistance and is evaluated in relation to price.
This is only a rough sketch of how the constituent elements work and for more detailed information you are advised to search the internet which has plenty of websites which explain in a great deal of detail how Cloud charts operate. However the information I have just given is sufficient to understand the results of the research because by far the most important element of the charts is the cloud and the relation of price to the cloud.
Ichimoku traders emphasise the need to look at all the indicators together before making trading decisions, however, in this paper I wanted to test the effectiveness of the charts, and so it was necessary to simplify the process of making trading decisions into ‘algorithms’ otherwise there was no objective way of testing performance. However, it should be borne in mind that the optimum way to use the charts, according to experienced practitioners is to use an inclusive and subjective analytical approach rather than a mechanical one.
Whilst it may be impossible to really test a method which relies on individual judgement to effectively implement, it is also true that there are unambiguous elements in the charts which can be objectively tested – such as, for example, the use of the cloud to identify trend. Clearly if the security is trading above the cloud there is no question that it is not in an uptrend – all other indicators also being bullish.
Therefore I used the cloud as the centre-piece of my test strategies which were all in essence simply variations on the theme of cloud breakouts, given these appeared to be the signals awarded the most significance in the existing literature on Ichimoku charts.
Cloud Breakout Strategy
The place of price in relation to the cloud is considered the most important factor in determining the trend using Cloud charts. In the initial strategy developed to test the clouds there had to be a definition of what a breakout constituted, given there might be false breakouts and breakouts can vary from simply perforations of the upper cloud to the requirement for a day’s activity after the break to confirm and so on.
In this experiment a breakout was defined in the flowing unambiguous terms:

A long breakout was defined by a two-step process. First it required an intraday break above the top of the cloud; then this had to be followed by a break of that day’s high by another day to initiate a hypothetical position with the trigger a point above the high. Another requirement was that the Tenkan line had to be above the Kijun Sen at the time of the initial breakout of the cloud and also for the second day’s confirmatory break too.
A short breakout was essentially the mirror opposite. It was defined as an intraday break below the bottom of the cloud followed by the requirement of another break below that day’s low on a subsequent day as a confirmation signal and a trade initiated at the low. The confirmation would have to be given before a signal in the opposite direction was given. In addition the Tenkan line had to be below the Kijun Sen for the set-up to be valid.
Cloud Breakout Strategy A
The initial experiment used a simple trading system of opening when a breakout signal was given and then running the trade until a breakout signal in the opposite direction was given. This would result in the open trade being closed out at the same time as a new trade was initiated in the opposite direction.
When backtested on EUR/USD from 1 st Jan 1999 to March 15 2012, the strategy generated a total of 50 trades altogether. The results are shown in a table beneath. They show the date of the breakout confirmation, the trigger prices, the direction of the trade and the resulting number of pips made or lost in terms of EUR/USD points.
The conclusion was that using this particular method of trading cloud breakouts would have proved unprofitable. Back-tested over a period of 13-years since the start of the euro it would have made a loss of 4568 pips.


