How Important is the Relative Strength Index
Post on: 16 Март, 2015 No Comment

The relative strength index. also known as the RSI. is one of the most frequently used technical oscillators for those interested in day trading. as well as long term buy and hold investors. On different trading platforms, the relative strength index may be called simply RSI or RSI Wilder. Wilder is the last name of the person who invented this popular oscillator.
Using the RSI
The relative strength index was designed to work on any financial markets and in any timeframe. Two popular uses include a simple oscillator and divergence reading.
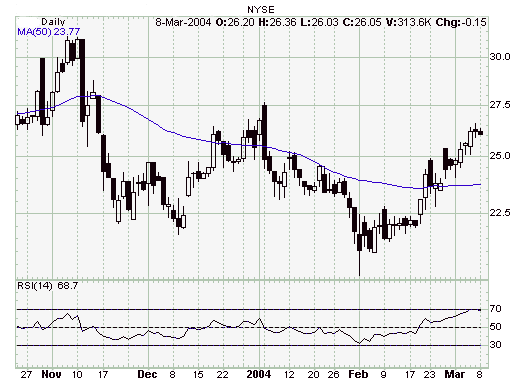
As an oscillator, the RSI treads up and down from 0 to 100. When above a reading of 70, the relative strength index is said to show an overbought market, where a bearing correction is soon to come. Likewise, below 30 on the scale, the RSI is said to indicate an oversold market, where the market will soon rise after being sold off too quickly or too much.
RSI divergence can work alongside the simple oscillator reading, since it is most commonly used to show ending trends and trend lines. RSI divergence occurs when the stock. bond. or other security’s price moves in a direction opposite of the RSI. Thus, if a stock were to move from $25 to $30 over a period of days while the RSI moved from 65 to 40, RSI divergence exists.
Traders play relative strength index divergences by placing a trade in the direction of the RSI movements. Therefore, in the example above, if the stock is moving up and the RSI down, a trader should place a short trade to profit in the short term correction. If the stock is moving down and the RSI up, a trader should make a long trade.
Relative Strength Index Settings
The RSI invented by Wilder comes with a default setting of 14 periods. This default setting means that the algorithm involved with the RSI utilizes data from the 14 previous bars, or points on a chart. On a daily chart, the RSI would use data for the 14 past trading days. On an hourly chart, the RSI would grab information from the last 14 hours.
The default setting can be revised, making the RSI movements more or less volatile. A setting of 25 will bring about smoother lines, whereas a 10 setting will bring about more volatility.
Also, traders can opt to read overbought and oversold oscillator levels at different readings. For instance, some traders consider above 65 and below 35 to be overbought and oversold. Others say above 80 and below 20 on the RSI are overbought and oversold. Much of this depends on the number of signals you wish to trade, as well as your goals within your own trading plan.
Trade the RSI
Critics of technical analysis claim that it is a study of self-fulfilling prophecy, and that indicators are only useful because others use them. The relative strength index is perhaps the best indicator to debunk this claim, since it was invented in the late 1970s and made very accurate, long-term buy and sell signals all the way back to the Great Depression. If you’re looking for just one more indicator to add to your collection, make it the RSI.


