HighYield Corporate Bonds Aren t As Risky As You Might Think
Post on: 12 Апрель, 2015 No Comment

Follow Comments Following Comments Unfollow Comments
When examining asset classes, domestic high-yield corporate bonds are typically categorized as one of the more risky of the fixed-income asset classes. This “risk” comes from the increased chance of default and is compensated for by the typically higher interest rates paid by the issuers of high-yield corporate bonds. This makes logical sense; higher risk requires higher return to get investors to invest.
In the course of our research we have discovered something very interesting in regards to bond asset class volatility; depending on the existing economic conditions, high-yield corporate bonds display lower volatility than investment-grade corporate bonds. A more risky asset class having a lower volatility may seem counter-intuitive, but it can occur.
Fig. 1: S&P 500 Index with NBER Recession Dates
Overlaying the S&P 500 Index (displayed as the red line in Fig. 1 above) against dates provided by the National Bureau of Economic Research for economic activity, we can identify three distinct periods in the past approximately nine years. The period labeled 1 is a period of economic expansion (and S&P 500 Index appreciation) occurring from November, 2001 until December, 2007. Period 2 is a period of economic recession (and S&P 500 Index depreciation) occurring from December, 2007 until June, 2009. Lastly, period 3 is again one of economic expansion, occurring from June, 2009 to March, 2011.
Let’s look closer at the first economic expansion period, period 1, occurring between November, 2001 and December, 2007, which is displayed below in Fig. 2. During this period, high-yield corporate bonds–represented by the Merrill Lynch High Yield Master II Index (MLHY) in green–had lower volatility than investment-grade corporate bonds–represented by the DJ Corporate Bond Index (DJCB) in yellow.
Special Offer: Some of Richard Lehmann’s recommended bonds, MLPs, preferreds and Canadian energy companies are providing yields up to 10%. Click here to begin profiting with Forbes/Lehmann Income Securities Investor .
The monthly standard deviation (SD)–calculated 4/9/02 to 12/1/07 due to data constraints– is only 1.03% for the MLHY versus 1.56% for the DJCB. Although you would think the “riskier” asset would be more volatile, the chart proves otherwise.
Why? We believe that during economic expansion, the default risk associated with high-yield corporate bonds lowers. Think about it: If the economy is performing well, the chance of bond default is less. As default risk is the primary driver of high-yield corporate bond prices, as opposed to interest rate direction, when the economy expands, the risk of high-yield corporate bonds defaulting is reduced and this is reflected in lower volatility. Also, as the economy improves, there is a tendency for interest rates to increase, which in turn can have a volatile effect on Investment-Grade Corporate Bonds. Here bond prices go opposite to interest rate direction.
Fig. 2: S&P 500 Index – DJ Corporate Bond Index – Merrill Lynch High Yld Master II Index
During Economic Expansion – Period 1
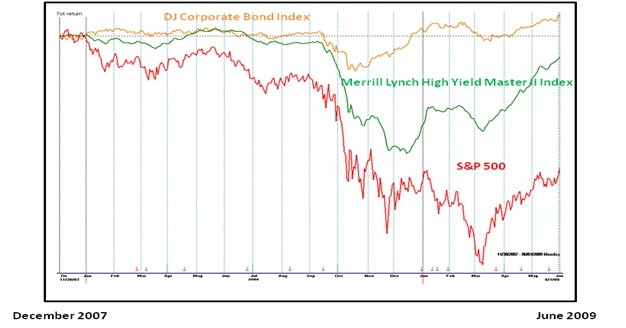
When we look closer at the period of economic contraction, identified in Figure 3 below, we see the exact opposite holds true; the Merrill Lynch High Yield Master II Index displays greater volatility in terms of monthly SD than the Dow Jones Corporate Bond Index. These SD’s are 3.04% for the MLHY versus 2.72% for the DJCB. Again, with default risk being the primary driver of High-Yield Corporate Bond prices, in a period of economic contraction the risk of default is increased. Greater risk of default brings greater volatility.
Fig. 3: S&P 500 Index – DJ Corporate Bond Index – Merrill Lynch High Yld Master II Index
During Economic Recession – Period 2
The third period identified, the expansion from June 2009 to March 2011 as shown below in Figure 4, further confirms this behavior. The Merrill Lynch High Yield Master II Index has a monthly standard deviation of 1.07% versus the Dow Jones Corporate Bond Index, whose monthly standard deviation is 1.81%.
Fig. 4: S&P 500 Index – DJ Corporate Bond Index – Merrill Lynch High Yld Master II Index
During Economic Expansion – Period 3
What does this mean for portfolio management? From these charts, history is suggesting that during times of economic growth, high-yield corporate bonds offer potentially higher returns than investment-grade corporate bonds, but more importantly with lower volatility. If this trend continues, by incorporating high-yield corporate bonds into a portfolio during periods of economic growth, not only can you capture potential higher returns, you can reduce overall portfolio volatility. Counter-intuitive? Perhaps, but challenging intuition, amongst very many other things, is the role of a good portfolio manager.
Following our routine tactical approach to investment management, in early 2009, Hanlon’s research and indicators identified high-yield corporate bond funds as the best risk-adjusted asset class. That decision has worked out well. We continue to hold considerable positions in high-yield corporate bond funds, where available.


