Going Delta Neutral with DX and SPY
Post on: 21 Апрель, 2015 No Comment

Instructor
This weeks article takes note of the inverse relationship of the U.S. Dollar, and the equity market and how you could use both to make a delta neutral trade.
Recently, I received the following email:
Hi Josip,
I was in your class in Kansas City last September and thoroughly enjoyed your teaching approach. I remember some of your explanations on Delta Neutral trades, but not enough to put it together yet. Can you direct me to an article that has examples with the explanations to help me review the concept? If you can do that for me, it would be great.
Thanks for your help.
The easiest way to look up something on the Online Trading Academy website is to type in the search box on the home page, just below the login, the exact words you are searching for. For instance, you have asked about my articles, so you could type Josip Causic Delta Neutral and the search engine is going to pull up at least five different articles that I have written on the topic.
In my own trading, I am using TLT as a hedge to bring myself to delta neutral in this volatile market. The TLT is a ticker for the exchange traded fund tracking the 20 Year U.S. Treasury Bonds. Historically, the Bond market is inverse to the equities. Normally, when the Bonds (TLT) are up, the market is down, yet we have had situations recently where both were trending in the same direction.
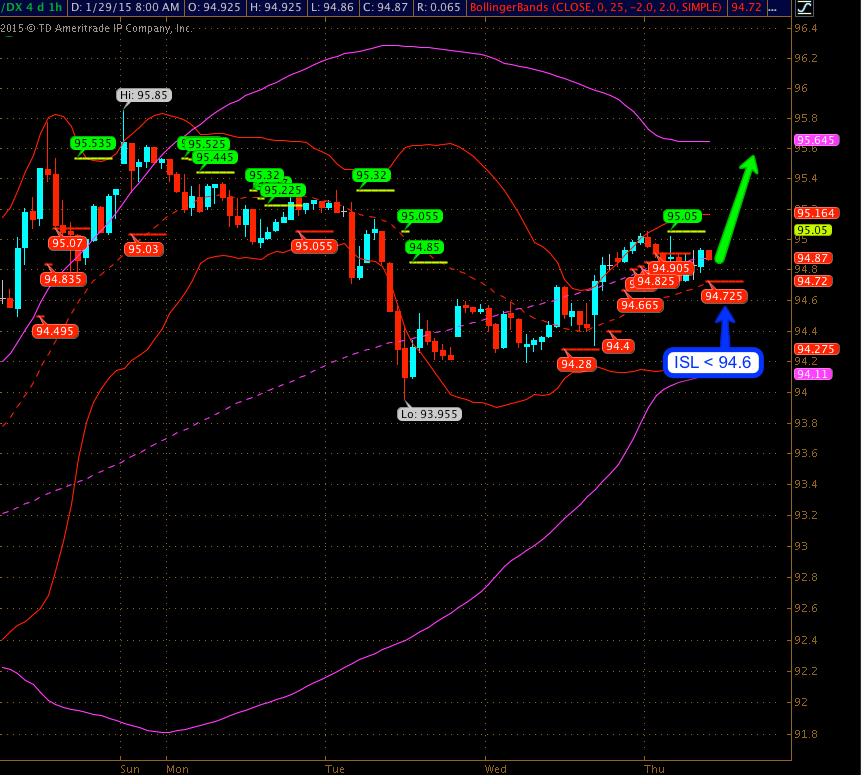
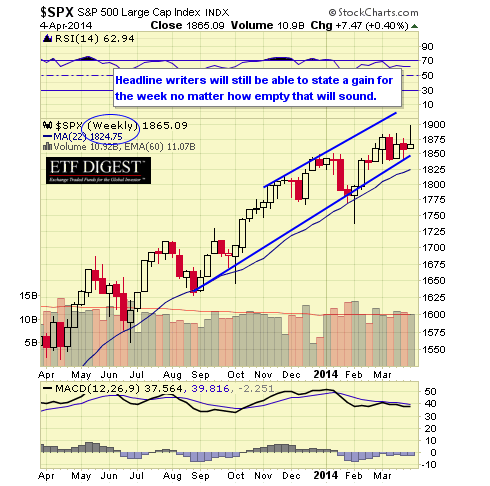
To answer the students question, a better delta neural hedge would be the U.S. Dollar versus the S&P. To present a clear case, I must turn to the charts. The only factual thing available to technical traders is the study of the price actions on the charts. This was not always as easily available as it is today, yet still too many traders are relying more on the television for the interpretation of the markets, equities and bond, than on the self-study of the charts.

Figure 1
On the left, the DX chart, I have attached the Fibs High point at 83.826 on Aug 24, 2010, and the Low at Nov 3rd at 75.253. Likewise, on the ES chart, I have used the same two points the High and Low, yet the dates slightly vary. July 6th was the ESs Low at 998.29 and Nov 5th was the ESs High at 1,224.46, hence, the clear inverse relationship is visually obvious. For simplicitys sake, I have added two Simple Moving Averages on the charts, the 20 day SMA in green and 50 day in red. On the ES chart, the price action, at the time of writing this article, has broken below the 20 day SMA and has now bounced off the 50 SMA. This type of pattern is very common. Once the 20 SMA is lost, the price can go down fast, within the next few sessions, to the 50 SMA. However, just because the price action goes towards the 50 SMA does not mean that it will close below it. Observe on the ES chart that, coincidentally, the 50 SMA overlaps with the Fibs 23.60%, and on at least three different occasions, the price action has come down to that level and bounced. This means that the 50 SMA is holding up.
Meanwhile, the DX chart shows the two moving averages crossing in the upward direction and the price rapidly approaching the Fibs 76.40 level. What this is telling us is that most likely that level could act as resistance and the U.S. Dollar might run into a speed bump. Simultaneously, the ES might bounce off its respective 50 SMA as well as the 23.60% Fib level.
As option traders, we might choose to sell some put spreads, yet instead of using options on the ES, which are pricey, we could substitute SPY using the short 118 put and long 117 put. The specifics are


