Fibonacci Retracement Trading Strategy
Post on: 14 Июль, 2015 No Comment

STRATEGY #6: Fibonacci Retracement — BreakOut
The Fibonacci Retracement Trading Strategy is more complicated than the other strategies I’ve shown you so far.
And while one doesn’t require indicators to trade this method after becoming experienced with using it, I’ll go ahead and explain it using indicators to keep any confusion to a minimum. After a while you’ll find your eyes become quite used to the pattern and you probably won’t need them.
FIBONACCI RETRACEMENT PATTERN
Price within all trading instruments, whether it be stocks, bonds, ETF’s, futures. or whatever, move in a 1 — 2 — 3 pattern in ALL time frames. In other words, every move up is followed by a retracement and then another move up.
If you have not noticed that yet, it might take some time, but eventually you will, if you study enough charts. There are times on a chart when it appears that statement might be false, but it is most likely that the retracement wasn’t obvious and probably hidden within a single bar.
I’m not going to go into all the details here about Leonardo Fibonacci and his series of numbers, and how the golden ratio or phi is seen continually throughout the natural world. No, the internet is full of information on all that. However, you might want to check it out, because it really is quite interesting.
You just need to know for now that Fibonacci day trading is centered around the golden ratio (.618) which is found by carrying out the number sequence (0, 1, 1, 2, 3, 5, 8, 13, 21, 34, 55, 89, 144, etc) far enough, and then dividing any number by the number that follows it.
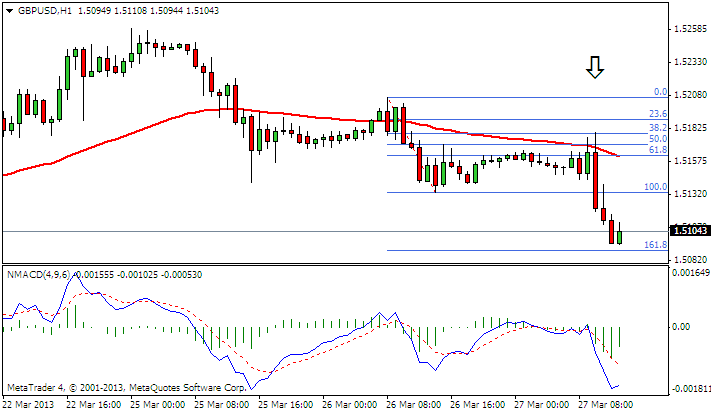
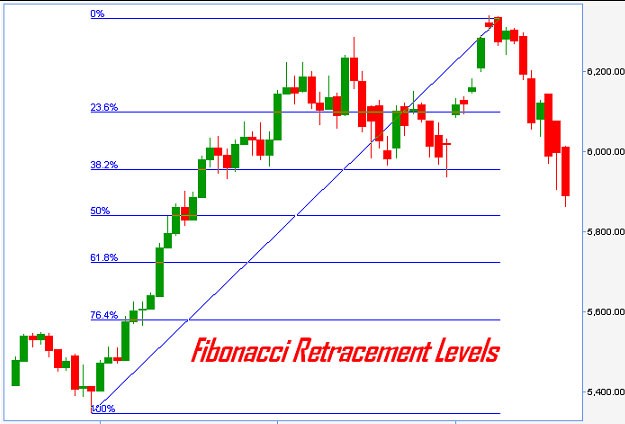
Popular Fibonacci retracement ratios or levels are .382 or 38% — and .681 or 62%. Important because they’re naturally and universally fulfilled or because so many traders know about and use them creating a self-fulfilling prophecy. who knows?
Do they really provide important support and resistance levels? Can they be used to predict future price movement off those particular levels? Doesn’t really matter as far as I’m concerned.
All I’m concerned about for this strategy, is that the stock has retraced enough and by enough I mean somewhere between 38% to 62%. And that’s not exact, just ball park.
Alright, so for this strategy we’ll use a multiple time frame setup with the following indicators.
COMPONENTS
30 min. chart: MACD (3,9,15 — with histogram), 15 sma, 35 sma, Fibonacci Retracement drawing tool
5 or 10 min. chart
FIBONACCI RETRACEMENT TRADING STRATEGY
On a 30 min chart, you are looking for a stock to have made a higher high than the last 2 days. You must have the 15 sma cross above the 35 sma on that day.
You’re then looking for price to give you a retracement back to between 38% to 62% on the following morning. Generally, you will see these stocks making an M pattern or an inverted U pattern on the 30 min. chart the day of the new high and moving average crossover.
Once price pulls back to the fibonacci retracement level of 38% to 62% the next morning. and you don’t have to have perfection here, if price retraces to a bit less than 38%, fine, if it retraces to a bit over 62%, fine. then look for price to form a rising bar on the MACD histogram.
The main point here is, you’re wanting to see a decent retracement with movement back in the direction of the impulse move.
Once you have this setup on the 30 min. chart, you’ve got a green light for a breakout trigger on the 10 min. chart.
Switching over to the 10 min. chart, you’re then waiting for a breakout of the high of the 30 min. bar that formed the setup.
FIBONACCI RETRACEMENT TRADING STRATEGY SIGNALS
Buy Setup: 30 min chart: Price makes higher high than previous 2 days. 15 sma crosses above 35 sma on that day. Price has pulled back to a fibonacci level of 38% to 62%. Price creates a rising bar on the MACD histogram.

Buy Trigger: 10 min. chart: Price breakout of high of 30 min. bar that creates the rising histogram bar.
Short Setup: 30 min chart: Price makes lower low than previous 2 days. 15 sma crosses below 35 sma on that day. Price has pulled back to a fibonacci level of 38% to 62%. Price creates a falling bar on the MACD histogram.
Short Trigger: 10 min. chart: Price breakout of low of 30 min. bar that creates the falling histogram bar.
Following is the 30 min. chart.
Now that the 30 min. chart has given the setup, a buy stop order can be placed above the high of the 30 min. bar high on the 10 min. chart.
As usual, if the buy order is triggered by a breakout of the high, place a stop under an appropriate level of support or with another method of your choice.
Following is the 10 min. chart.
Fibonacci retracement trading strategy setup/triggers are harder to find and trade than the previous five strategies, since the stocks don’t just fall into your lap from a gap or gainers list like the other trading strategies do.
They require more work to find — and once found, they frequently have already been setup and triggered.
But, if you can locate them the night before, and then watch for that first rising histogram bar the next morning, the strategy produces some very nice trades.
Of course, if you can do some simple programming for a scan then it’s no problem.


