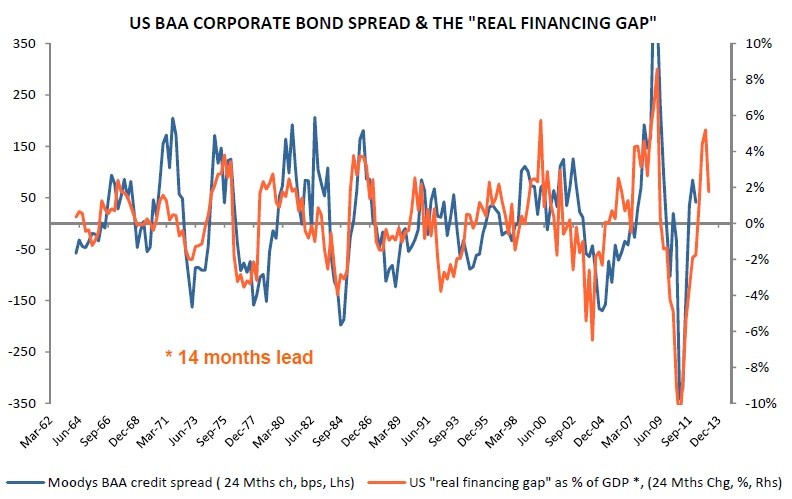
Covering the Spread Credit Spreads as Leading Indicators
Post on: 17 Апрель, 2015 No Comment

Jump To
Spreads are blowing out! Spreads are razor thin!
These phrases mean little inside the Beltway. But on Wall Street credit spreads are a crucial indicator of the health of the economy. This paper explains how policymakers can use the same crystal ball market experts use to analyze the future direction of the economy.
What Exactly is a Credit Spread?
Credit spreads are very simple. They are nothing more than the difference in yields—or current market interest rates—between corporate bonds and government bonds of similar maturities. If a 10-year Treasury bond has a 2% yield and a 10-year bond issued by GE has a 5% yield, “the spread” is 3%. That was easy, but unless you are a bond investor, why should anyone in Washington care?
Spreads are predictors of future economic activity. When credit spreads are thin, it signals investor confidence in the economy. It means investors do not foresee businesses getting into trouble or failing to pay off their loans. A thin spread means investor are thinking, “hmm, that GE bond is almost as safe as a U.S. Treasury bond.” It also means they think GE is doing awfully well and will continue to do so in the future. And if a lot of corporate bonds have thin spreads, it shows this confidence cuts across the entire economy.
In contrast, widening credit spreads show deteriorating conditions in credit markets and investor nervousness about the overall business environment. They often indicate that investors are demanding a high premium to lend to corporations. The wider the spread the more serious investor concerns are about the economy. 1
Narrow spreads indicate confidence in the economy. Yet credit spreads are affected by supply and demand dynamics for bonds in addition to confidence in economic outlook.
For example, the U.S. is currently in a very low interest rate environment. This makes it tough for investors to earn a decent return and for institutional investors—such as pension funds and insurance companies—to meet investment targets. These institutional investors need to earn a certain level of return to ensure future payments to beneficiaries.
The phenomenon of investors looking for higher returns in a low interest rate environment can be referred to as “reaching for yield.” This means investors are willing to buy riskier assets—while accepting smaller returns—than they have been historically.
Some financial analysts have asserted that investors are currently reaching for yield—increasing the demand for riskier bonds, lowering their yield, and narrowing their credit spreads. In other words, the fact that spreads for riskier bonds are lower than usual doesn’t necessarily reflect great confidence in the economy, but rather that investors are reaching for yield. In short, narrow spreads may reflect specific supply and demand factors in addition to confidence in the economy.
Why are U.S. government bonds the yardstick?
Government bonds, at least for countries that have their own currency like the U.S. are usually considered safer than corporate bonds because they are much less likely to default. Corporations cannot print money, and even the most venerable and safe firms can fail—remember Kodak, TWA, and Borders?
Since they have less default risk, government bonds typically offer lower interest rates than corporate bonds with similar maturities. The spread between a corporate bond and a government bond is the extra yield—or return—that investors require to buy corporate bonds to account for the risk of default.
Of course, some government bonds are safer than others. U.S. Treasury bonds are often used as the government benchmark in credit spreads, as they are considered the safest asset in the world. For the purpose of determining spreads, all U.S. corporate bonds are compared to Treasuries. The importance of Treasuries as a benchmark in credit spreads is one of the many reasons why it is so vital that the United States never defaults on its debt. Treasuries are the measuring stick used to determine the relative riskiness of nearly every other major investment in the world. If that stick wobbles, measuring the rest of the financial system becomes more complicated.
How Do Spreads Predict the Future?
When evaluating credit spreads, the key is not the specific number, but its relationship to historical data and trends over time. Say the spread between Treasury bonds and the bonds issued by AAA-rated companies is 3%. As a stand-alone figure, it doesn’t mean much. But if you know this spread is usually less than 1%, and it was 2% only last month, then that 3% figure is a strong indicator that economic conditions are rapidly deteriorating—or at least the market perceives that to be the case.
There are many different credit spreads—spreads that compare individual bonds, bonds of particular industries, or bonds of particular countries to Treasury bonds. One set of spreads used frequently by market experts to analyze future economic conditions is from Bank of America Merrill Lynch (BofA).
BofA assembles a variety of credit spreads by constructing indexes of similar corporate bonds—such as bonds with the same credit rating—allowing investors to get a peek at the health of the corporate sector. These indexes can be found on the website of the Federal Reserve Bank of St. Louis (FRED) .
Credit Ratings Refresher
As a refresher on bond ratings, credit rating agencies rate corporate and government bonds according to their likelihood of default, with ratings ranging from AAA to C. Bonds with a rating of BBB or higher are referred to as “investment grade,” meaning they have a low risk of default. “High yield” bonds—also called “junk” bonds—have a rating of BB or worse, and carry a higher risk of default than investment grade bonds. 2 This doesn’t mean high yield bonds are a bad investment, it means they offer a higher return for the increased risk of default they pose.
Credit spreads are used as a tool by investors to measure the perceived creditworthiness of the corporate sector. And of course, if the corporate sector isn’t healthy, it does not bode well for job creation and overall economic growth.
Below we focus on two graphs, the first represents the spread between Treasury bonds and different classes of investment grade corporate bonds. The second graph adds high yield bonds to the mix and combines all investment grade corporate bonds into one index.
Bank of America Merrill Lynch Corporate Credit Spreads1996-2012 3
Let’s start with the first chart above. Each line represents the spread between an index of corporate bonds of a similar credit rating and U.S. Treasuries at similar maturities. So, for example, the spread between AAA-rated corporate bonds and U.S. Treasuries at the end of 1996 was almost zero. This indicated a belief that a strong U.S. economy made corporate bonds issued by blue-chip companies such as Exxon and Microsoft about as safe an investment as possible. For less highly rated investment grade bonds, the spreads were wider, but were still less than 100 basis points (100 basis points = 1%). Obviously, this was a great time for the U.S. economy.
Jump forward to early 2007 and investment grade bonds have been stable for four years, with AAA-rated bonds trading between 50 and 70 basis points above Treasuries. By autumn 2007, the spread for AAA-rated bonds reached 100 basis points for the first time since early 2000 (the beginning of the tech bubble recession). By the end of 2007, the spread was 136 basis points. At this point in time, very few people in Washington were talking about a recession, let alone the worst downturn in 80 years. The spread reached 221 basis points on the day Lehman Brothers failed on September 15, 2008. By the end of the year, the spread had reached 400 basis points, and peaked at just over 600 basis points in the spring of 2009. 4 To underscore, when the spread is 600 basis points, it means that investors are demanding an additional 6% return in comparison to the return on Treasuries for investing in the most highly-rated corporate bonds in the world. That indicates a very wary group of investors.
Bank of America Merrill Lynch Corporate Master and High Yield Indexes 1996-2012 5

In this second chart above, we look at two BofA indexes that present a wider snapshot of corporate sector health. The Corporate Master Index represents all investment grade bonds, and the High Yield Index represents all high yield bonds. The High Yield spread peaked above 1000 basis points in the tech bubble recession. At that level investors are demanding a lot of compensation to invest in high yield bonds. But in the Great Recession, spreads topped 2000 basis points. 6 These levels are very rarely seen. These riskier bonds can be the canaries in the coalmine as they tend to represent the companies that would have the most trouble weathering a downturn—though not all high yield bonds will do poorly in a recession.
Conclusion
Credit spreads are an important gauge for financial markets. On June 7, 2013, the BofA index for AAA-rated bonds stood at 68 basis points. They have traded in a narrow band between 59 and 68 basis points since the first of the year. So too has the investment grade corporate sector as a whole, with the BofA Corporate Master Index sitting at a 154 basis point spread on June 7 th and trading in a band between 141 to155 basis points since the New Year. 7
These spreads indicate confidence in the corporate sector, especially compared to our recent past. Yet America is still recovering from the Great Recession. Comments from Federal Reserve Chairman Ben Bernanke on June 19 regarding the future of quantitative easing shook financial markets. The BofA index for AAA-rated bonds peaked at 73 basis points on June 30 th. while the BofA Corporate Master Index peaked at 172 basis points on June 24 th .
Since these peaks the indexes have fallen—as of July 24 th the AAA index stood at 68 basis points and the Corporate Master index stood at 162 basis points. 8 Was the recent rise in these indexes just a blip, or is it indicative of changing market sentiment about the corporate sector?
Investors use a variety of tools when assessing economic conditions, and don’t rely on any single measure. Yet by monitoring credit spreads going forward, policymakers can obtain valuable information about investor sentiment on the health and direction of the economy.
Endnotes
www.pfhub.com/calculating-yield-and-understanding-yield-curve/ .
www.standardandpoors.com/ratings/definitions-and-faqs/en/us .
research.stlouisfed.org/fred2/categories/32297 .
research.stlouisfed.org/fred2/categories/32297 .
research.stlouisfed.org/fred2/categories/32297 .
research.stlouisfed.org/fred2/categories/32297 .
research.stlouisfed.org/fred2/categories/32297 .
research.stlouisfed.org/fred2/categories/32297 .


