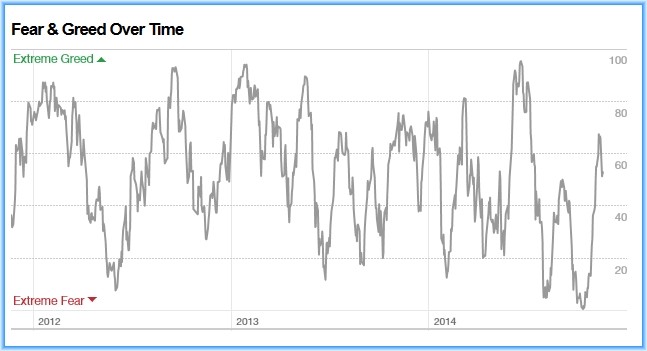
CNN Money s Fear and Greed Index
Post on: 6 Август, 2015 No Comment

There are two emotions that tend to cloud our judgement when making investment decisions: fear and greed. We can be both fearful of losing money and missing out on the opportunity to make more. Additionally, greed may influence you to invest more capital than you really should, thus wreaking havoc on your financial plans risk management strategy.
The worlds best investors and traders have honed their ability to minimize the impact of emotion within their investment decision making process. The following quote from Warren Buffet characterizes the need to take a counter-intuitive approach to emotion when investing; Be fearful when others are greedy, be greedy when others are fearful. In other words, investors should sell stocks when the market is overbought (greedy) and buy when the market is oversold (fearful).
While the concept of buying fear and selling greed is obviously a sound and statistically valid method of timing the market; determining when the market is fearful and greedy can be difficult. In theory, if investors and traders could identify these broadly defined points in time, they could be handsomely rewarded for their savvy. In an effort to measure when the market is fearful and greedy CNN Money has created the Fear & Greed Index .
Whats Inside the Fear and Greed Index?
CNN Money has used the following 7 indicators as data sources into their Fear and Greed Index model:
Stock Price Strength. This measure compares the volume of stocks hitting their 52 week high vs. the volume of stocks hitting their 52 week low. Greed is indicated as more stocks begin hitting their 52 week high, or are at least trading in the higher end of their 52 week price range.
Junk Bond Demand. This measure is determined by the spread between the yield demanded by investors for junk bonds (high risk asset) and the yield demanded for lower risk corporate bonds. As fear begins to spread through the market, investors begin to demand a higher yield for riskier assets. Fear is signaled as the yield spread between riskier bonds and their safer counterpart increases over historical averages.
Safe Haven Demand. This indicator measures the relative performance of bonds (low risk and safe asset) as compared to stocks (high risk asset) and subsequently the demand for each type of asset. As investors become greedy they will begin to sell bonds and allocate a higher percentage of their portfolio to stocks.
Stock Price Breadth. CNNs Fear and Greed Index uses the McClellan Volume Summation Index to measure advancing and declining volume on the New York Stock Exchange (NYSE). Fear in the market will be indicated by an increases in selling volume (more shares sold than bought).
Market Volatility. The index uses the Chicago Board Options Exchange (CBOE) Volatility Index (VIX) to measure market volatility. The VIX is often referred to as the Fear Index, however it measures implied volatility in either direction (bullish or bearish).
Put and Call Options. The fear and greed index uses the put/call ratio to compare the volume of bullish call options verses their bearish counterpart the put. As investors become greedy they will begin to buy more call options and less puts.
Market Momentum. Market momentum (whether bullish or bearish) is measuring the S&P 500s (SPX) price versus its 125-day moving average. Greed is indicated as price moves further above its moving average, and thus fear is indicated as price momentum accelerates below its moving average.
While I like the simplicity of the Index and the methodology they used to measure the fear and greed in the market, however I do have the following suggestions. First, I would like the ability to easily compare historical S&P 500 price data with the indexs output. I would use this data to uncover any statistical significance between the two for use in probabilistic simulations.
Second, I would like to be able to vary the time frame of the index. Providing the ability to measure the fear and greed in the market in different time frames would appeal to a wider population of investors (day and swing traders, buy and hold investors, etc.). Finally, I would like to understand how each of the indicators were weighted and have an option to vary that weight.


