Choppiness Index Forex Trading Indicators
Post on: 16 Март, 2015 No Comment

Coppock Curve
Choppiness Index
This lesson will cover the following
If you have any questions or suggestions you are welcome to join our forum discussion about Choppiness Index .
Designed by E.W. Dreiss, the Choppiness Index is used to help traders determine whether the market is moving in a distinct direction, or it is trading sideways. It is similar to the broadly known Average Directional Movement Index as they are both developed to gauge a trends strength and movement direction. However, some traders regard the Choppiness index as the superior indicator.
The Choppiness Index is an indicator which is not directional. It does not predict future market direction, rather reflects whether the market is choppy (trades sideway) or smooth (trending). The general way of interpreting this index is that higher values mean the market is choppy, while lower values equal directional movement.
Its formula involves the following calculation:
Choppiness Index = 100 * LOG10(SUM(ATR(1),n) / (MaxHi(n) MinLo(n))) / LOG10(n), where:
ATR(1) is the Average True Range (Period of 1)
SUM(ATR(1), n) is the sum of the Average True Range over past n periods
MaxHi(n) is the the highest high over the past n periods
MinLo(n) is the lowest low over the past n periods

The results are displayed on a scale of 0 to 100. The closer the data is to 100, the choppier the market is, and vice versa. Default settings include Fibonacci-based upper and lower band of 61.8 and 38.2 respectively, which reflect when a trend or trading range are becoming excessive.
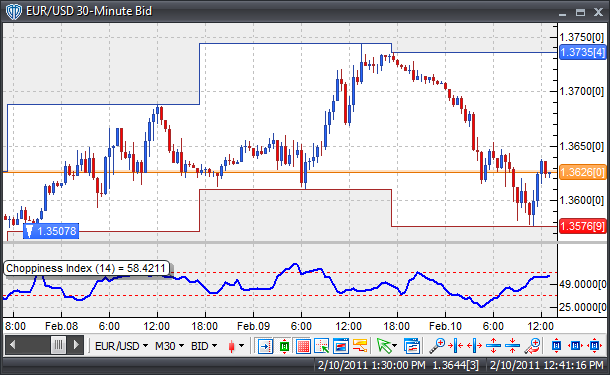
The Choppiness Index does not reflect the markets movement direction, but instead shows whether a trend is strong or not (the closer the indexs value is to zero – the stronger the trend is). Conversely, the more heavily the market is consolidating, the closer the index will be to 100. The screenshot below illustrates the indicator in a trading software.
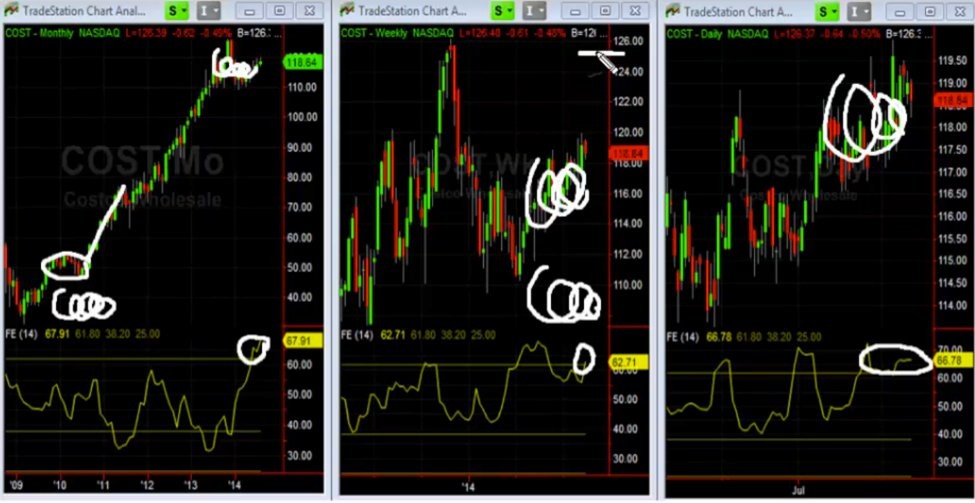
There are a couple of assumptions that stem from the numbers listed above. Because values above 61.8 are observed during tight trading ranges, as the index rises above the upper band, it suggests that the market might be in for a strong breakout in the near future after the recent periods of tight consolidation.
Conversely, because values below 38.2 occur during strong trends in either direction, the index falling below the lower band is often a sign that market momentum might begin to wane in the near future as the trend enters its exhaustion phase.
However, just like overbought and oversold levels in indicators such as the Relative Strength Index etc, you shouldnt base your decision-making entirely on the Choppiness index rising above 61.8 or dropping below 38.2, rather use it in conjunction with other indicators as a confirmation tool (for example Parabolic SAR).
If you have any questions or suggestions you are welcome to join our forum discussion about Choppiness Index .


