ChartAdvisor for March 13 2015 (SPY DIA QQQ IWM)
Post on: 16 Март, 2015 No Comment

The U.S. markets were mixed over the past week, as of Thursday’s close. With the U.S. dollar’s rising valuation, some economists are concerned that the economy could take a hit due to less competitive exports. Gallup’s U.S. Economic Confidence Index was negative for the week ended March 8th, although the – 3 figure is still significantly higher than it has been at most times since the 2008 U.S. economic crisis .
International markets were mixed over the past week, as of Thursday’s close. Japan’s Nikkei 225 rose 1.48%; Britain’s FTSE 100 fell 2.18%; and, Germany’s DAX 30 rose 2.15%. In Europe, improvements in some key economic indicators could present a turning point for the regional economy, although there’s a 1-in-4 chance that Greece will exit. In Asia, China’s economy continues to struggle despite its rising steel exports.
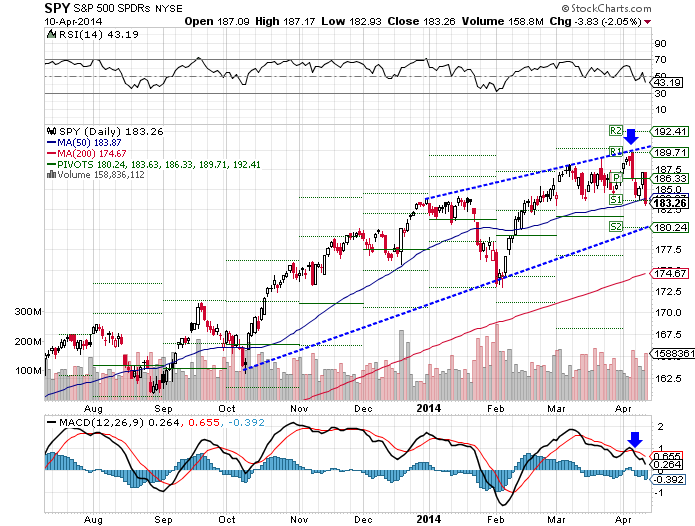
The S&P 500 SPDR (ARCA: SPY ) fell 0.18% over the past week, as of Thursday’s close. After reaching its lower trend line support, the index rebounded slightly toward its pivot point at 206.92, although it still remains below its open this week. Traders should watch for a breakout above the pivot point to the upper trend line resistance at around 212.75 or a move down to re-test its lower trend line support. Looking at technical indicators, the RSI appears to be neutral at 47.57 although the MACD remains in a bearish downtrend.
The Dow Jones Industrial Average SPDR (ARCA: DIA ) rose 0.32% over the past week, as of Thursday’s close. After falling to its lower trend line resistance at around 176.00, the index rebounded mid-week past its pivot point at 177.69. Traders should watch for an extended move higher toward its upper trend line resistance and R1 support at 185.74 or a move back down to re-test its lower trend line support. Looking at technical indicators, the RSI appears neutral at 50.09, but the MACD remains in a prolonged bearish downtrend.
The PowerShares QQQ Trust (NASDAQ: QQQ ) fell 1.5% over the past week, as of Thursday’s close. After breaking out from its upper trend line resistance back in February, the index topped out and is now re-approaching these levels. Traders should watch for a rebound from these prices to re-test its higher or R1 resistance at 111.64 or watch for a breakdown below these key levels toward S1 support at 102.45. Looking at technical indicators, the RSI appears neutral at 46.57, but the MACD remains in a bearish downtrend.

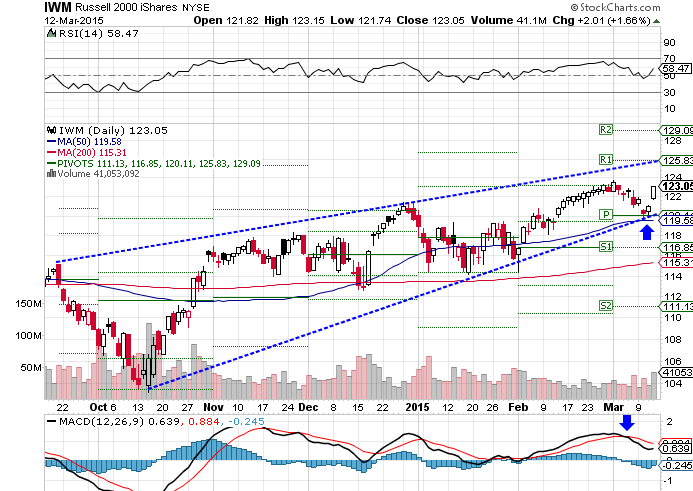
The iShares Russell 2000 Index ETF (ARCA: IWM ) rose 1.55% over the past week, as of Thursday’s close. After rebounding from its lower trend line support and pivot point at 120.11, the index rebounded sharply higher toward the middle of its channel. Traders should watch for a move higher toward upper trend line resistance at 125.83 or a move down to re-test its pivot point and lower trend line support. Looking at technical indicators, the RSI appears a bit lofty at 58.47, while the MACD remains in a modest bearish downtrend.
Looking Ahead
The major indexes were mixed over the past week, as of Thursday’s close, as investors remain a bit cautious on the markets. Next week, traders will be watching a number of key economic indicators. including industrial production on March 16th, housing starts on March 17th, FOMC data on March 18th, and jobless claims on March 19th.


