Can Emerging Market Bonds Help Us Predict The Next Bear Market
Post on: 2 Август, 2015 No Comment

Can Emerging Market Bonds Help Us Predict The Next Bear Market?
Deals At Home Spark Monday Gains
If you did not follow the markets Monday, a fair question would be what caused the tone to improve. M&A news is the answer. From The Wall Street Journal :
“Deals, more deals, higher prices for the latest deal or corporate willingness to step-up and make strategic acquisitions are all reasons” for the S&P 500?s latest run to new highs, says Andrew Wilkinson, chief market analyst at Interactive Brokers LLC. “For investors that means a swift return to confidence on Monday helping drive the S&P 500 index to a new record high.”
Mailbag: Should We Be Tracking Emerging Market Bonds?
We were recently asked in a handful of emails about the importance of emerging market bonds (PCY) relative to the S&P 500. The basic question was “should we be tracking the emerging market bond ETF (EMB) to monitor the health of the S&P 500 (SPY)?” Since the concepts are important relative to investment risk management, in this article we will explore correlation and causation, and address the question about emerging market bonds.
“Most of you will have heard the maxim correlation does not imply causation. Just because two variables have a statistical relationship with each other does not mean that one is responsible for the other. For instance, ice cream sales and forest fires are correlated because both occur more often in the summer heat. But there is no causation; you dont light a patch of the Montana brush on fire when you buy a pint of Haagan-Dazs.”
Nate Silver, The Signal and the Noise: Why So Many Predictions Fail — But Some Dont
To answer the question about PCY and EMB, we must first understand the concept of investment correlations. In the simplest form, if two ETFs are positively correlated, they tend to zig and zag together. If they are negatively correlated, when one zigs the other one tends to zag.
Since investing impacts college educations, retirement plans, and quality of life, we should base our decisions on facts rather than generalizations about what is relevant and what is not relevant in the world of investing. Therefore, let’s look at some hard evidence about how important it is to track the performance of emerging market bonds to manage risk in a U.S. stock portfolio.
Correlations: A Picture Is Worth A 1,000 Words
If two ETFs were perfectly correlated, their correlation would be 1.0; conversely, if they were perfectly correlated in a negative fashion, their correlation would be -1.0. It seems reasonable that the S&P 500 and the broader Total Stock Market ETF (VTI) are positively correlated. In a bull market, the vast majority of stocks go up. In a bear market, the vast majority of stocks go down. If you are interested in the health of SPY, VTI could serve as a useful input.
The correlation between SPY and the DOW Diamond ETF (DIA) is also consistently high and consistently useful, but not as useful as VTI.
As you might guess, the further we move away from a broad basket of stocks, the less useful and meaningful the correlation becomes to SPY. For example, the NASDAQ (COMP) has a positive correlation to SPY, but like DIA, it is not as useful as VTI.
How Do Emerging Market Bonds Correlate to SPY?
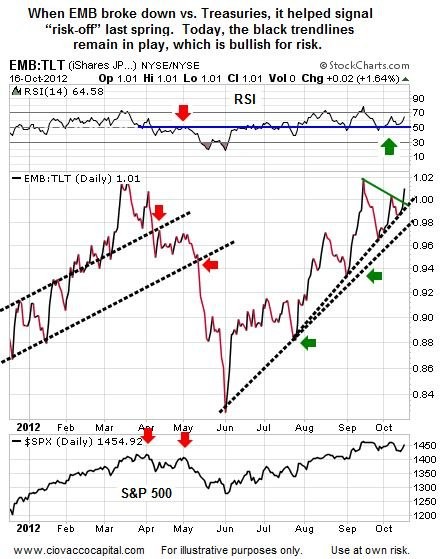
Common sense tells us that there are a lot of moving parts between SPY and emerging market bonds. For example, they are tied to different economies that operate under various forms of government. Their markets are regulated by different laws. As the charts below show, EMB’s correlation to SPY is all over the map; sometimes it is positive, sometimes it is negative.
Since EMB has only been trading since 2008, we will use the PIMCO Emerging Market Bond Fund (PEBAX) to examine the longer-term correlation between the S&P 500 and emerging market bonds. Correlations are the most useful when they are consistently close to 1.0. The long-term correlation between SPY and emerging market bonds looks like a Richter Scale reading following some unsettling in the San Andreas Fault.
For us, a minimum standard of “usefulness” is a correlation of 0.50. The chart below shows all the periods in the last 14 years where emerging market bonds failed to meet the minimum standard.
It Can Help, But It Can Hurt As Well
Let’s assume we were going to use emerging market bonds as a guide to help us monitor the health of our U.S. stock portfolio. The version of the chart below shows periods where emerging market bonds had a negative correlation to the S&P 500, which means instead of helping us, emerging market bonds would have hurt us (gave bad info).
Is the health of emerging market economies relevant to the U.S. stock market? Yes, it is. All things being equal, would SPY investors prefer to see healthy EMB and PCY charts? Yes, they would, but there are countless ways to monitor the health of the U.S. stock market that produce much more consistent and highly correlated results. From a risk management perspective, anything that has a positive correlation one week and a negative correlation the next week, is an accident waiting to happen from an input perspective.
Did Emerging Market Bonds Warn Early In 2000?
We can find many things that were helpful before and during the 2000-2002 bear market, but we would not include emerging market bonds on that list.
How About Before The 2008 Financial Crisis?

As shown in the chart below both emerging market bonds (top) and the S&P 500 (bottom) posted gains between 2005 and Q4 2007.
2014: Borrowing Frenzy Consequences?
From a fundamental perspective, slow growth tends to help pull the curtain back exposing economic areas of vulnerability. Slow growth is one of the concerns worrying U.S. investors. From The New York Times :
Prospecting for oil in Brazil, manufacturing steel in Russia, erecting skyscrapers in China: Global bond investors have financed some of the grandest investment projects taken on by emerging economies in recent years. But as growth falters in a number of developing nations, economists and regulators have become increasingly worried about the consequences of this borrowing frenzy and the risk that the mutual funds and hedge funds that have largely replaced more stable commercial banks as global financiers might all decide to rush for exits at the same time. “It’s fair to say that the market got a little overexuberant,” said Scott A. Mather, the head of global portfolio management at the mutual fund giant Pimco. “Many years of private sector credit growth have created serious vulnerabilities.”
Monitoring U.S. Stocks Directly
If future weakness in emerging market bonds eventually leads to weakness in the S&P 500, then we know with 100% certainty that the weakness will show up in the form of observable evidence on the chart of SPY. Why bother with the middle man when we can track SPY directly to manage risk? Are there things that can help for a correlation perspective? Yes, the video in an August 2013 article covers numerous ways to monitor the health of the U.S. stock market, but nothing is superior to tracking SPY directly, which speaks to monitoring price.
Current Market: Bullish, But Vulnerable
This week’s stock market video looks at some vulnerable areas in the bullish case. It covers the S&P 500 from a daily, weekly, and monthly perspective.
After you click play, use the button in the lower-right corner of the video player to view in full-screen mode. Hit Esc to exit full-screen mode.
Investment Implications
While the S&P 500 was unable to post a new closing high Monday, SPY was able to clear that hurdle. The weight of the evidence remains bullish and the set-up described on February 17 remains relevant. Monday’s gains moved the ball enough to warrant another small incremental addition to our broad U.S. stock holdings (SPY). The lack of progress in stocks over the past eight weeks has cracked a door open for the bears, which is why we still have some exposure to bonds (TLT) and cash.
1,850 Still Important For Bulls And Bears
A reversal in stocks below 1,850 on the S&P 500 would be concerning. On the other end of the spectrum, if the bulls can take the S&P 500 above 1,850 for any sustained period, it will result in more bullish check marks within our market model. With housing data, consumer confidence, durable goods, and GDP on the economic docket this week, it is prudent to have plans in place for a move away from 1,850. We also have FED-related calendar items this week. From Reuters :
Many traders are looking ahead to Thursday, when Federal Reserve Chair Janet Yellen will speak to the Senate Banking Committee in her semi-annual testimony about monetary policy. Yellens comments will be scoured for insight into the extent to which bad weather has affected economic activity, as well as for confirmation that the Fed will not make any changes to its schedule for trimming stimulus.
This entry was posted on Monday, February 24th, 2014 at 10:02 pm and is filed under Stocks — U.S.. You can follow any responses to this entry through the RSS 2.0 feed. Both comments and pings are currently closed.


