Bonds Yield Curves and Spreads
Post on: 17 Апрель, 2015 No Comment

Updated 05-03-2010 at 02:09 PM by Magic
This is the first step into the more advance aspects of bonds as the major sentiment indicator of global and national markets. From here everything is inter-related. The inflation affects monetary policy, affects interest rates, affects bond prices, affects the yield curve, affects the CPI, affects inflation (or vice-versa). Though I’ve separated them as much as possible, they are a repeat of the same thing from different, but very important. perspectives. Again, I will use the US as the example and start with the yield curves and some spreads, then inflation and, finally, interest rates.
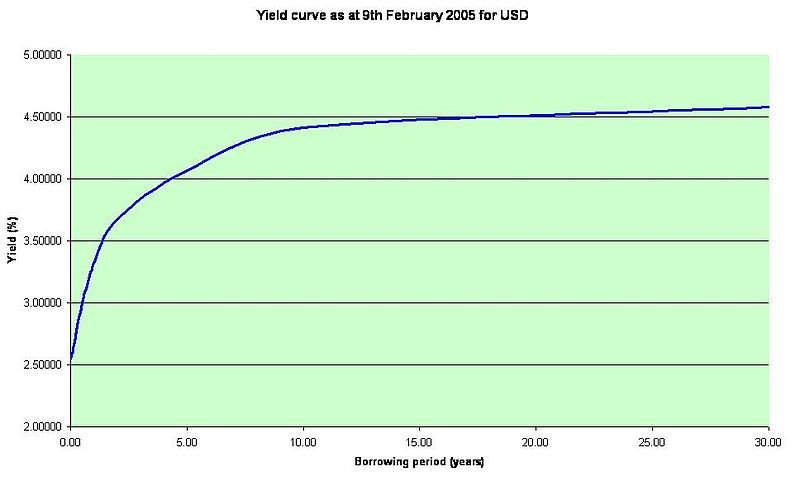
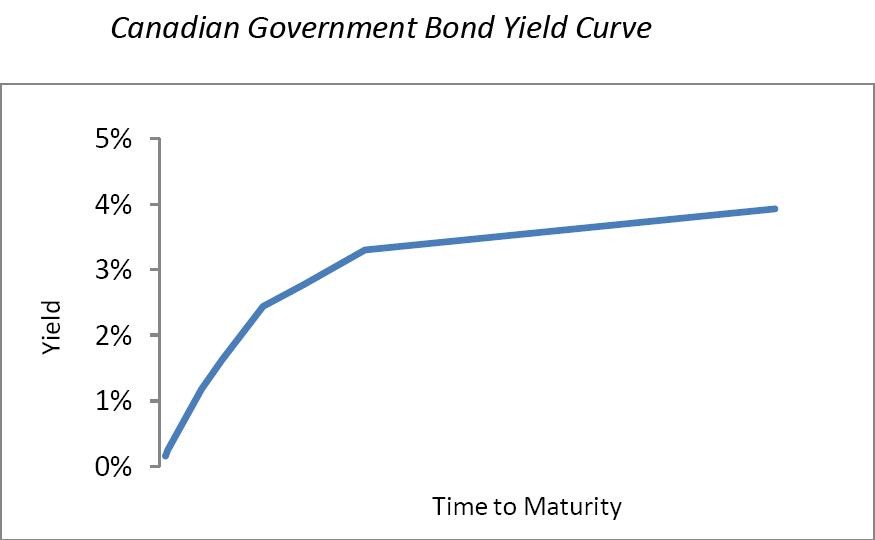
Remember, yield is the return an investor will receive by holding a bond to maturity. The yield curve is a simple financial chart or graph. The line on a yield curve chart plots the interest rate of bonds at set times and gives the relation between the interest rate to be paid to the bond holder and the time to the maturity of the bond. For example, the U.S. dollar interest rates paid on U.S. Treasury securities for various maturities are closely watched by many traders, and are commonly plotted on a graph such as those below which are informally called the yield curves. Sometimes these curves are referred to as the term structure of interest rates .
The Yield Curve can tell us a lot about what investors’ expectations for interest rates are and whether they believe the economy is going to be expanding or contracting. These yield curves come in three standard types: the Normal Yield Curve, the Flat Yield Curve and the Inverted Yield Curve.
Normal Yield Curve . A normal yield curve tells us that investors believe the Federal Reserve is going to be raising interest rates in the future. Typically, the Federal Reserve only has to raise interest rates when the economy is expanding and the Fed is worried about inflation. Therefore, a normal yield curve often precedes an economic upturn.
Flat Yield Curve . A flat yield tells us that investors believe the Federal Reserve is going to be cutting interest rates. Typically, the Federal Reserve only has to cut interest rates when the economy is contracting and the Fed is trying to stimulate growth. Therefore, a flat yield curve is often a sign of an economic slowdown.
Inverted Yield Curve . An inverted yield curve tells us that investors believe the Federal Reserve is going to be dramatically cutting interest rates. Typically, the Federal Reserve has to dramatically cut interest rates during a recession. Therefore, an inverted yield curve is often a sign that the economy is in, or is headed for, a recession.
The Benchmark
The chart shows investors from around the world what to expect in the future from the US Federal Reserve. Yield curves are used by fixed income analysts, who analyze bonds and related securities, to understand conditions in financial markets and to seek trading opportunities. The yield curve on the US Treasury long bond, for instance, mirrors the market’s view on US interest rates, inflation, public-sector debt, and economic growth. Beause of it’s safety, it is considered the benchmark from which all other securities are compared. Since all other securities are considered riskier, their yield must reflect the added risk — else everyone would just buy bonds.
The most common yield curve used to compare bonds is the yield curve of U.S. Government Treasury bonds. This curve measures the three-month, two-year, five-year, and thirty year U.S. Treasury debt. This curve can be used to compare other lesser quality bonds, and is used as a benchmark for other kinds of debt including mortgage rates and bank loan rates. The curve is also used to predict changes in the economy and estimate economic growth
Yield Spreads
Once you understand the benchmark aspects of one security over another or a class of securities, it is easy to move on to applying this to various markets. Below, Paul Conley shows more in the bond markets. Then I’ve included an article by Kathy Lien applying spreads to the forex market — very interesting.
Inverted, flat or normal — — yield curves offer a slew of information by Paul Conley
A yield curve is a simple representation of the relationship between the interest rate that a bond pays and when that bond matures.
But as simple as that concept may be, understanding the significance of movement in a yield curve can be a complicated. Here are few key things to remember:
You can create a yield curve using any two bonds. But the most popular curves are the ones used as benchmarks by institutional investors. For example, most bond traders are intimately familiar with the yield curve on treasury securities. While traders of municipal bonds, or munis, closely follow the curve on AAA-rated general obligation muni bonds. Charts of both those curves are widely available on sites such as Bloomberg News .
In a sane and normal world, the line on a yield curve rises as it moves from left to right. What that is saying is that the interest rates are higher on bonds with a longer maturity. That’s logical. If I were to lend you a $1,000 for two years, I might charge you 5% interest a year. But if I were to lend you $1,000 for 10 years, I’d require a higher interest payment to cover the risks associated with waiting longer to get my money back.
But in the bond market, things aren’t always logical. An inverted yield curve occurs when interest rates are lower for longer maturities than for shorter ones. It’s rare when the curve on Treasuries inverts. Doing so is seen as a sign of recession.

The most important item in a yield curve is the spread. That’s the difference between the interest rates paid on any two bonds in the curve.
For example, if a 30-year bond pays 4.90% while a 10-year bond pays 3.95%, the spread is 0.95%.
Fixed-income investors use spreads as a simple measurement by which to compare bonds — similar to the way equity investors use price/earnings ratios to compare shares of stock.
You can spend a lifetime trying to understand the nuances of yield curves. Economists dedicate considerable effort to learning what moves a curve up or down. But average investors don’t need to concern themselves with much more than the basics. Once you understand what the benchmarks are doing and what the spreads are on the bonds you’re considering for purchase, you can make an educated decision about what to add to your portfolio.
The Carry Trade is simply an interest rate arbitrage.
The global markets are really just one big interconnected web. We frequently see the prices of commodities and futures impact the movements of currencies, and vice versa. The same is true with the relationship between currencies and bond spread (the difference between countries’ interest rates): the price of currencies can impact the monetary policy decisions of central banks around the world, but monetary policy decisions and interest rates can also dictate the price action of currencies. For instance, a stronger currency helps to hold down inflation, while a weaker currency will boost inflation. Central banks take advantage of this relationship as an indirect means to effectively manage their respective countries’ monetary policies.
By understanding and observing these relationships and their patterns, investors have a window into the currency market, and thereby a means to predict and capitalize on the movements of currencies.
When the yield spread began to rise once again in the summer of 2000, the Australian dollar responded with a similar rise a few months later. The 2.5% spread advantage of the Australian dollar over the U.S. dollar over the next three years equated to a 37% rise in the AUD/USD.


