Basics of Bollinger Bands
Post on: 22 Июль, 2015 No Comment

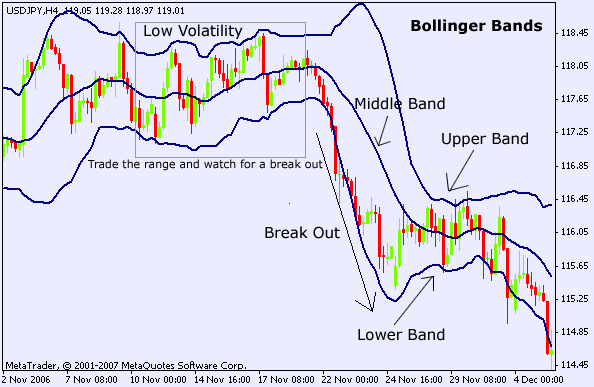
Taking a look at the basics of Bollinger Bands you cant go far wrong with the Bollinger Bands analysis tool. It is designed to predict highs and lows of a particular investments price, whether the investment is in bonds, stocks or foreign currency. This analytical device was first developed by John Bollinger and has gained welcome acceptance among many investors and traders.
What is a Bollinger Band?
A Bollinger Band is comprised of three parts:
· A middle price called a moving average, usually calculated over 20 days.
· An upper range, or band, that reflects the price movement above the moving average.
· A lower range, or band, that reflects the price movement below the moving average.
Rather than using percentages, the bands are calculated using a standard deviation. By plotting the moving average with the high and low activity ranges on a chart, it is possible to get a realistic idea of a stocks high and low prices. With this tool traders can see the development of patterns and act accordingly.
How Bollinger Bands Are Used
Different investors have their own interpretation of the Bollinger Bands and how to use the data. There are traders who will only buy a stock when the price is near the bottom of the lower band and subsequently sell when the price is near the very top of the higher band. Other investors choose to buy at any price in the lower band and sell when the price reaches the moving average or slightly above it.

How They Are Viewed
When the gap between the two bands is small, traders consider this stock to have very little change, or volatility. Conversely, when the two bands have a large area between them the stock shows a lot of volatility. Traders will look at the bands over a period of time to look for a trend in the price. The moving average helps to smooth out the volatility so that traders can clearly see if the true price is moving up or down.
When the prices are constantly appearing in the upper band it is generally accepted that the stock is overpriced. On the other hand, when the prices regularly appear in the lower band then the stock is underpriced leading to more buys.
Most investors that incorporate the basics of Bollinger Bands into their analysis will begin by identifying the upper and lower bands. On a chart, lines will be drawn connecting all of the upper bands and the same will be done for the lower bands. This begins to form a channel that can be seen easily across the chart. The investor can then decide at which points to buy and subsequently sell the stock.
Investors know that most stocks trade multiple times on a given day and that their price will rise and fall according to the level of activity. Rather than focusing on these tiny incremental changes, the Bollinger bands can enable traders to step back and take a much bigger view of the overall trading. This bigger view will allow the investor to find a pattern that is in line with their overall financial goals.


