Balance of Payments Q4 2013
Post on: 16 Март, 2015 No Comment

Contents
Key points
- The United Kingdom’s (UK) current account deficit was £22.4 billion in Quarter 4 2013, down from a revised deficit of £22.8 billion in Quarter 3 2013. The deficit in Quarter 4 2013 equated to 5.4% of GDP at current market prices, down from 5.6% in Quarter 3 2013.
- The trade deficit narrowed to £5.7 billion in Quarter 4 2013, from £10.0 billion in Quarter 3 2013.
- The income deficit increased to £10.3 billion in Quarter 4 2013, from £5.9 billion in Quarter 3 2013.
- The financial account recorded net inward investment of £23.6 billion during Quarter 4 2013.
- The international investment position recorded UK net liabilities of £21.2 billion at the end of Quarter 4 2013.
- In 2013, the UK’s current account deficit was £71.1 billion.
Summary
The balance of payments summarises the economic transactions of the UK with the rest of the world. These transactions can be broken down into three main accounts; the current account, the capital account and the financial account.
The current account comprises of the trade in goods and services account, the income account and current transfers. A difference in the monetary value of these accounts is known as the current account balance. A current account balance is in surplus if overall credits exceed debits and in deficit if overall debits exceed credits.
A deficit or surplus on the current account is offset with an equal and opposite surplus or deficit on the capital and financial account. As the capital account is relatively small in comparison, the current account and financial account can be said to be counterparts.

The current account balance plus the capital account balance measures the extent to which the UK is a net lender (that is, in surplus) or net borrower (that is, in deficit). The UK has run a combined current and capital account deficit in every year since 1983 and every quarter since Quarter 1 2008.
Figure 1: Current account balances (Seasonally adjusted)
Download chart
Quarterly
In Quarter 4 2013, the UK was a net borrower of £20.9 billion, down from £21.6 billion in Quarter 3 2013. This was due to the total trade and current transfers deficits narrowing by £4.3 billion and £0.6 billion respectively. Partially offsetting these was a widening in the total income deficit of £4.4 billion.
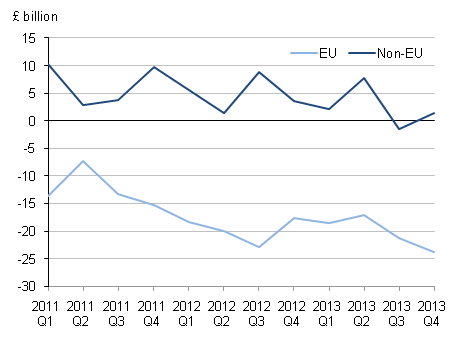
The narrowing in the total trade deficit was due to a fall of £3.0 billion in the trade in goods deficit and an increase of £1.4 billion in the trade in services surplus. Imports of goods fell £3.4 billion, primarily due to lower imports of oil, semi-manufactured goods, and finished manufactured goods which fell by £1.4 billion, £1.0 billion and £0.9 billion respectively in Quarter 4 2013. Exports of goods decreased by £0.4 billion in Quarter 4 2013. The increase in the trade in services surplus was due to exports increasing by £1.0 billion and imports decreasing by £0.4 billion in Quarter 4 2013.
The widening of the income deficit was mainly due to foreign earnings on portfolio investment in the UK increasing by £2.5 billion in Quarter 4 2013. Additionally, UK earnings on direct investment abroad decreased by £5.0 billion from Quarter 3 2013 to Quarter 4 2013, partially offset by foreign earnings on direct investment in the UK decreasing £3.5 billion over the same period. The decline in earnings in both UK earnings abroad and foreign earnings in the UK were due to monetary financial institutions switching from profits in Quarter 3 2013 to losses in Quarter 4 2013.
Annual
In 2013, the UK was a net borrower of £65.7 billion, up from £55.4 billion in 2012. This was mainly a result of increased deficits in income and current transfers, partially offset by a decreased deficit in trade.
The investment income deficit increased from £3.7 billion in 2012 to £17.0 billion in 2013. This was mainly due to a decrease in the direct investment income surplus, as income receipts (credits) decreased and income payments (debits) increased in 2013 compared with 2012. Receipts were lower primarily due to a decrease in the earnings from private non-financial corporations. Additionally, the deficit on portfolio investment increased, partially offset by a decrease in the other investment deficit.
The deficit on current transfers increased from £22.5 billion in 2012 to £27.1 billion in 2013. The increase was mainly due to payments (debits) increasing by £4.0 billion and receipts (credits) decreasing by £0.6 billion.
The deficit on trade decreased from £33.4 billion in 2012 to £26.6 billion in 2013. This was due to the trade in services surplus increasing by £5.9 billion to £81.2 billion and the trade in goods deficit decreasing by £0.9 billion to £107.8 billion.
In 2013, the current account deficit equated to 4.4% of GDP at current market prices, compared with 3.8% in 2012. The deficit in trade in goods and services was equivalent to 1.6% of GDP in 2013 compared with 2.1% in 2012, and the income deficit equated to 1.1% of GDP in 2013 compared with 0.2% in 2012.


