Asset Class Correlation It s All Bunk
Post on: 30 Апрель, 2015 No Comment

Asset Class Correlations
Ever hear about asset class correlations? Well, its all bunk.
The idea of asset correlations is this: A 1.0 is perfect correlation. Meaning if Asset X moves up then Asset Y moves up in lockstep. A correlation of -1.0 is perfect negative movement. If Asset Y moves up then Asset Z moves down. Usually the range of correlations falls between the perfect positive correlation of 1.0 and perfect negative of -1.0.
You see this in investing books all the time. Stock asset classes X and Y have a correlation of 0.67 while bonds A and B have a correlation of 0.22, etc. You just throw them together and you get instant diversification! It looks so scientific being two decimal places and all.
Well, allow me to let you in on a secret: This information is worthless at best and dangerous at worst.
A World of Correlations
In the investing world many decide to build a portfolio using historical correlation data. They look at all of these assets over the years and assign a correlation number between them to try to figure out a relationship and how much of each you should own.
For instance over the past 30 or so years:
Total Stock Market and the Total Bond Market have a correlation of about 0.34. Meaning that some of the time are they moving upward at the same time but sometimes they arent.
Total Stock Market and Total International Stock Market have a correlation of 0.66. A stronger correlation indicating that if one is going up the other probably is, too.
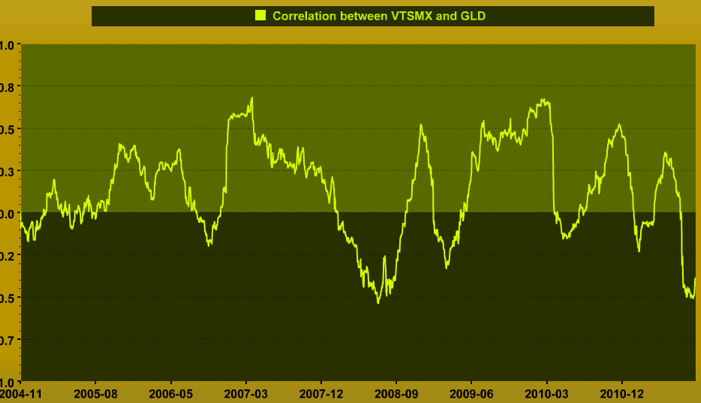
Total Stock Market and Gold have a correlation of -0.27. Meaning that if the stock market is going up in value that gold is probably going down and vice versa.
Now you take a bunch of assets with different correlations and you are hoping that when one zigs the other zags. This diversification effect means over time that as one is gaining in value another is falling. During good markets you may give up some gains, but in down markets you have some assets that should do well to offset the losses.
Good theory, but normally used poorly in practice.
The reality is that asset class correlation data is irrelevant and can get you in trouble. In 2008 for instance many people held assets that supposedly had low correlation historically. Yet, when the markets crashed the correlations went up sharply and they all went down together. The diversification selected failed and large losses followed. Many claimed that Diversification failed in 2008.
Diversification didnt fail. What failed are how portfolios were built to diversify the risks.
There are two primary failures with looking at asset class correlation alone:
1) Looking at correlation data without considering the underlying economy at the time covered.
2) Correlation data encapsulates big blocks of multi-decade returns which loses visibility into the specific events happening under the covers.
Lets talk about these two things.
Its Hot in Miami and New York Who Cares?
What about the underlying economy? Why is this a big deal?
Let me explain using the weather. Below is a list of average temperatures in Fahrenheit in three cities:


