Asset Allocation Strategy the 60
Post on: 6 Апрель, 2015 No Comment

This is the third installment of our series on asset allocation. The first article was on buy and hold SP500. where we learned that risks were relatively high (2 drawdowns > 45%) over the past 20 years to earn a compound annual growth rate of 6.46%. The second article was on buy and hold of the Dow Jones Composite Bond Index . This passive strategy earned a return slightly less than buy and hold SP500 (5.35% v. 6.46%). However, the risk of loss was considerably less with buy and hold DJ Composite Bond Index. The largest equity curve drawdown was 14.72%. In this report, we will combine these two assets into a portfolio that is 60% equities and 40% bonds.
Bonds are our great diversifier, and when incorporated into an equity portfolio, it is our intention to reduce risk without sacrificing gains. In essence, the sum of the parts (stocks plus bonds) is better than either entity alone. The “traditional” 60/40 asset allocation to stocks and bonds is typical of what you might have with a broker. Once again, this is a passive portfolio in that you “set it and forget it”.
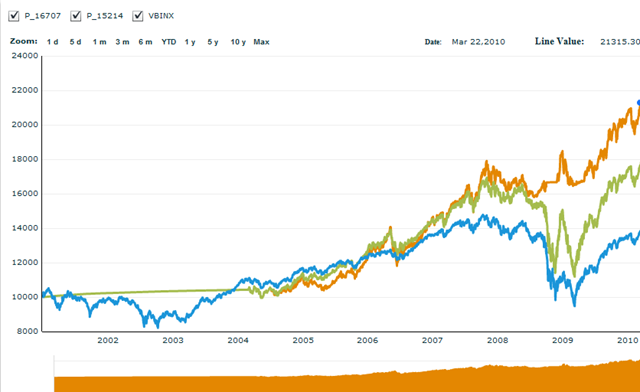
From November, 1991 to March, 2011, a portfolio comprised of 60% SP500 and 40% DJ Composite Bond Index yielded a compounded annual growth rate of return of 6.05%. $100,000 becomes $312,740. Figure 1 shows the equity curve for this passive 60/40 portfolio (green line) v. buy and hold SP500 (red line).
Figure 1. 60/40 (SP500/ DJ Composite Bond) v. SP500/ Equity Curve
Drawdown is the peak-to-trough decline (in percentage terms) of an investment, and it is measured from the time a retrenchment begins to when a new high is reached. Drawdown is a measure of risk. The maximum draw down for this passive 60/40 portfolio was 40%. This is still relatively high, but far less than the maximum draw down of 55% for buy and hold SP500. As of March, 2011, the longest draw down period for this 60/40 portfolio was 317 weeks. The draw down curve, comparing this passive 60/40 portfolio (green) to buy and hold SP500 (red), is shown in figure 2.
Figure 2. 60/40 (SP500/ DJ Composite Bond) v. SP500/ drawdown
A 60/ 40 portfolio of SP500/ DJ Composite Bond Index yielded a return that was 0.5% per year less than buy and hold SP500. However, this “diversified” portfolio had considerably improved drawdown characteristics over buy and hold SP500. In essence and as expected, a diversified passive strategy beats a non- diversified passive strategy when considering both risk and reward.
Next time we will make our portfolio active by rebalancing once a year. In the process, we will confirm the notion that an actively managed, diversified portfolio beats a passive, non- diversified strategy.
To learn more about the tactical asset allocation portfolios provided by ARL Advisers, LLC, we have a new brochure and short PowerPoint presentation available.
ARL Advisers, LLC is a registered investment adviser in the State of Kentucky with clients throughout the country. ARL Advisers is the publisher of TheTechnicalTake blog. ARL Advisers provides investors an alternative to passive money management and the limited asset allocation models of financial advisers.

%img src=http://feeds.feedburner.com/
ff/blogspot/vPeU?d=yIl2AUoC8zA /% %img src=http://feeds.feedburner.com/
ff/blogspot/vPeU?i=QAW1KWO-3EQ:RXd_R8bLDHY:XhI0_UKdTUU /% %img src=http://feeds.feedburner.com/
ff/blogspot/vPeU?d=dnMXMwOfBR0 /%
%img src=http://feeds.feedburner.com/


