5 Reasons Your Simple Bear Market Plans Could Backfire
Post on: 27 Май, 2015 No Comment

Summary
- Many well-intentioned investors have created simple how-to-spot-a-bear-market systems. Those systems often lead to common investment mistakes in the real world.
- The systems are often one-sided and lack the flexibility to adjust to rapidly changing market conditions.
- A real-world quiz highlights the need to account for rapid changes in the market’s tolerance for risk caused by market intervention or changing fundamentals.
- If we apply these concepts to the present day, we find a vulnerable stock market telling us to nail down our risk management triggers in the event weakness continues.
Weekends are a good time to review investment risk management strategies. If an approach or system can manage to avoid the common bear market pitfalls below, the odds of successfully navigating though the next crisis should improve:
- You think you know what is going to happen next.
- Your plan is not flexible enough.
- Failing to understand the strengths and weaknesses of technical analysis.
- Government and central bank intervention.
- Economic turnaround.
Bear Market Preparation Is Crucial
Anyone who suffered through 50%-plus stock declines in the periods 2000-2002 and 2007-2009 can tell you that bear markets can cause many sleepless nights. The table below shows how damaging a bear market can be to your future plans of relaxation and retirement.
Trends Speak To Interpretation Of Fundamentals
Our analysis below uses charts. Does that mean the fundamentals do not matter? Absolutely not. The interpretation and perception of present day economic activity, earnings, Fed policy, etc. are what drive the charts and determine asset prices. The charts help us monitor the present day read on all the fundamental data, which includes expectations about the future. The previous sentence aligns with the expression the fundamentals are captured in the charts. Fundamentals and people determine asset prices, not charts. Charts are a monitoring mechanism.
When Bullish Economic Conviction Is High
As we outlined on March 13. trends speak to investor conviction about the economy and markets. The 200-day moving average is used to monitor the health of the long-term trend. The 50-day moving average is used to monitor the intermediate-term trend.
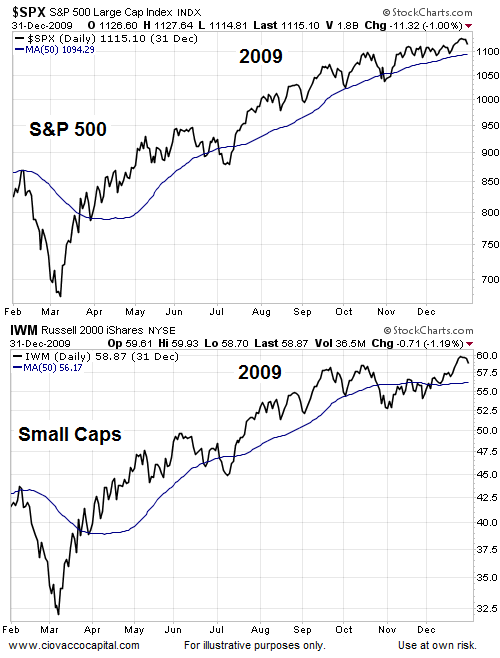
The S&P 500 chart below shows what a full bore bullish market looks like, when bullish economic conviction is clearly outpacing bearish economic conviction. The positive slopes on the blue and red moving averages align with investor expectations that the economy will continue to grow.
When Bearish Economic Conviction Is High
In the early stages of a bear market, the tipping point is reached when the net aggregate perception of future economic outcomes shifts to the bearish camp.
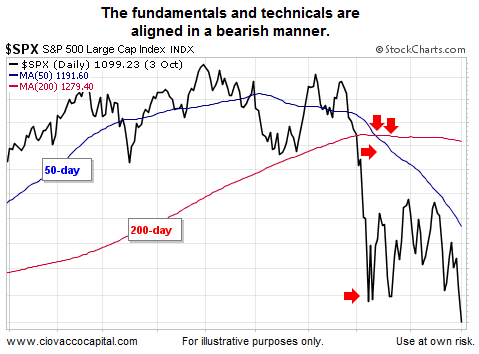
When the stock market’s trend is tentative, it indicates a shift in the aggregate economic outlook of all investors around the globe. The negative slopes on the blue and red moving averages align with investor fear and concerns about the economy.
You do not need to know anything about technical analysis to see the differences in the two charts above. All things being equal, the odds of investment success are higher in stocks when we have the sunny skies look. Conversely, the odds of success in stocks drop significantly when we have a stormy sky look.
A Fundamental and Technical Quiz
Our investment conviction should be strongest when the fundamentals and technicals align, meaning ugly charts, ugly economic data, and increasing systemic risk are a bearish combination from a probability perspective. Before you provide an answer of bullish or bearish, take the facts below into consideration. During the period in question, these were the known fundamental issues of the day:
- Increasing concerns about debt defaults
- Increasing risks in global banking system
- Political uncertainty
- Recent quarterly GDP readings showing contraction
- Current GDP readings expected to be weak
The bullets above tell us the fundamentals are shaky in our hypothetical quiz scenario. The technicals for our quiz period are shown below. Our quiz chart looks like the early stages of a bear market with (1) S&P 500 below both its 50-day and 200-day moving averages, (2) bearish slope on 50-day, (3) 50-day below 200-day, and (4) bearish slope on 200-day.
If you answer the quiz objectively, the correct answer is to take a more defensive or bearish stance, given the fundamental and technical backdrop. However, your bear market plan could unravel quickly if you make one of the most common investment mistakes of deciding in advance what is going to happen next. With the known bearish backdrop in our quiz, it would be easy to say:
We are entering a new bear market. Therefore, I am going to significantly reduce my exposure to stocks, and I may even consider taking this easy opportunity to short the market.

A Little Knowledge Can Be A Dangerous Thing
Markets have a cruel way of allowing us to be right just long enough so we can become overconfident and complacent. If we take our quiz chart ahead a few weeks, it would be easy to look at the chart below and say:
Wow, the fundamentals are a mess, the S&P 500 just broke important support, and the chart looks like the early stages of a new bear market, I think I’ll add to my shorts and cut my long positions again.
We Don’t Ever Know What Will Happen Next
If you have made up your mind that a new bear market has started, then if the evidence begins to shift, you will start viewing everything through a lens with a bearish bias. The chart below shows what happened next. Stocks did not enter a new bear market. Instead, they rallied over 27% in the next six months.
Market Intervention Needs To Be Accounted For
What happened in 2011 to flip the playing field from risk-off to risk-on? Europe was a mess at the time and policymakers and central bankers intervened. While there were many factors that led to a big rally in stocks, the most significant was the European Central Bank’s unlimited three-year loans to ailing financial institutions. If market intervention is successful in turning the sentiment tide, then improving economic data may not be far behind.
The Fundamentals Were Not Good
Before we move to ways to avoid these common mistakes, you may want to refresh your memory concerning the fundamental issues that were present during our quiz. The blurbs below recapping 2011 events from BBC News can help:
In February, eurozone finance ministers set up a permanent bailout fund, called the European Stability Mechanism, worth about 500bn euros.
In April, Portugal admits it cannot deal with its finances itself and asks the EU for help.
In May, the eurozone and the IMF approve a 78bn-euro bailout for Portugal.
In June, eurozone ministers say Greece must impose new austerity measures before it gets the next tranche of its loan, without which the country will probably default on its enormous debts.
Talk abounds that Greece will be forced to become the first country to leave the eurozone.
A second bailout for Greece is agreed. The eurozone agrees a comprehensive 109bn-euro ($155bn; 96.3bn) package designed to resolve the Greek crisis and prevent contagion among other European economies.
In August, European Commission President Jose Manuel Barroso warns that the sovereign debt crisis is spreading beyond the periphery of the eurozone.
The yields on government bonds from Spain and Italy rise sharply — and Germany’s falls to record lows — as investors demand huge returns to borrow.
On 7 August, the European Central Bank says it will buy Italian and Spanish government bonds to try to bring down their borrowing costs, as concern grows that the debt crisis may spread to the larger economies of Italy and Spain.
The European Commission predicts that economic growth in the eurozone will come to a virtual standstill in the second half of 2011, growing just 0.2% and putting more pressure on countries’ budgets.
The IMF cuts growth forecasts and warns that countries are entering a ‘dangerous new phase’.
Lessons From The 2011 Reversal In Stocks
There is nothing wrong with using fundamentals and technicals to manage risk in your portfolio. Your approach needs to be flexible and nimble, allowing your portfolio to adjust quickly when conditions change. If you want to improve your odds of navigating through the next crisis, the keys to success below, outlined in detail in October 2013. still apply:
- Think in probabilities
- Develop an IF, THEN system
- Monitor the big picture
- Remain highly flexible
Will We See Intervention In The Next Crisis?
This is a topic for another day. However, experience tells us that those in power (elected representatives, government leaders, and Fed governors) want to stay in power (get reelected or reappointed). Nobody, including Fed Chair Janet Yellen, wants a crisis to occur on their watch. The political party in power never wants a weak stock market or weak economy heading into mid-terms or a presidential election. When push comes to shove, history tells us it is highly unlikely those currently in power will stay on the sidelines as stocks and the economy drop, putting their positions in jeopardy.
Moving To The Present Day
The technicals in 2014 are moving closer to a vulnerable state. The fundamental and geopolitical news continue to fall into the concerning category. From Bloomberg :
Russia remained on collision course with the West over Ukraine’s separatist Crimea region as six hours of talks between the country’s top diplomat and his U.S. counterpart failed to ease tensions. President Vladimir Putin is not prepared to make any decision regarding Ukraine until after the referendum on Sunday on joining Russia, U.S. Secretary of State John Kerry told a news conference after the meeting in London today. Russia will respect the will of the Crimean peoples, Russian Foreign Minister Sergei Lavrov told a separate news conference, saying there’s no common vision on resolving the crisis.
The economic data revealed Friday contributed to the downbeat mood on trading floors. From The Wall Street Journal :
In the U.S. economic data came in weaker than expected. A report showed consumer sentiment in early March declined to 79.9, the lowest reading since November. Separately, a measure of producer prices for February fell 0.1%, bucking forecasts for an increase.
Investment Implications — Another Round Of Risk Reduction
Our market model incorporates the concepts of thinking in probabilities and flexibility by converting known information about the big picture into an IF, THEN system. The model called for a second incremental step to reduce our equity exposure (NYSEARCA:SPY ) Friday. Our core positions continue to be SPY and technology stocks (NASDAQ:QQQ ). This week our allocation to stocks contracted and our cash position expanded. The market remains in a more vulnerable state, but bearish conviction is not yet strong enough to carry the day, which can be seen in the flattish nature of the S&P 500’s 50-day moving average below. The market’s current profile requires a high degree of flexibility. With a Fed meeting on this week’s docket, we must be willing to increase or decrease our equity exposure based on the incoming data and evidence.
Further Weekend Study
The articles below expand on the concepts covered above:
Disclosure: I am long SPY, QQQ. I wrote this article myself, and it expresses my own opinions. I am not receiving compensation for it. I have no business relationship with any company whose stock is mentioned in this article.


