2013 Bond Market Performance The Year in Review
Post on: 26 Июль, 2015 No Comment

Bond Market Returns: What Worked and What Didn’t in 2013
You can opt-out at any time.
The bond market received more than it share of headlines for its poor performance in 2013, as concerns that the U.S. Federal Reserve would taper its “quantitative easing ” program caused investment-grade bonds to suffer their worst year since 1994. This also represented the second-worst year for investment-grade debt since 1980, the first loss since 1999, and only the third time in 34 years the asset class finished the year in the red.
Nevertheless, investors still had plenty of opportunity to make money in bonds. While the longer-term. higher-quality, and most interest-rate sensitive segments of the market lost ground, a number of areas – among them high yield bonds, senior loans, and short-term bonds – finished the year in positive territory. The result: an investor who was appropriately diversified – or who chose to access the market with individual bonds rather than bond funds – could have ridden out the year with minimal damage despite the upward spike in long-term Treasury yields.
2013 Bond Market Return Data
The 2013 returns of the various asset classes within the bond market are as follows:
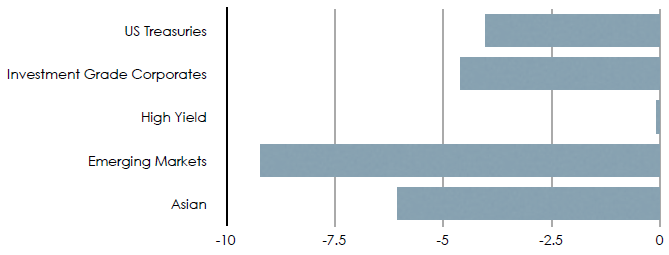
Short-term U.S. Treasuries (Barclays 1-3 Year U.S. Government Index): 0.37% Intermediate-term U.S. Treasuries (Barclays US Government Intermediate Index): -1.25%
TIPS (Barclays US Treasury Inflation Linked Bond Index): -9.26%
Corporate bonds (Barclays Corporate Investment Grade Index): -1.53%
High yield bonds (Credit Suisse High Yield Index): 7.53%
Senior Loans (S&P/LSTA Leveraged Loan Index): 5.29%
International government bonds (SPDR Barclays International Treasury Bond ETF): -3.59% Emerging market bonds (JP Morgan EMBI Global Diversified Index): -5.25%
See the returns of all U.S. bond ETFs here .
The 2013 Timeline
Although 2013 will be remembered as a difficult year for the bond market, the first four months of the year were relatively benign. Even as warnings about the looming downturn in bonds continued to permeate the financial press, bonds remained supported by accommodative U.S. Federal Reserve policy, strong investor demand, and the combination of low inflation and slow growth. As of April 30, investment-grade bonds were in positive territory with a gain of just under 1%.
This favorable backdrop changed abruptly in May when Fed Chairman Ben Bernanke suggested that the Fed may soon “taper” its quantitative easing policy. Adding fuel to the fire were signs of strengthening economic growth, led by the recovery in the U.S. housing market. The bond market reacted violently as investors rushed to take profits before the Fed began to withdraw its support: from May 2 to June 25, the yield on the 10-year note soared from 1.63% to 2.59% — an extraordinary move in such a short period of time. (Keep in mind, prices and yields move in opposite directions ). This yield spike led to a sharp downturn throughout the entire bond market, with even segments that typically exhibit low interest-rate sensitivity suffering substantial losses.
The bond market continued to drift lower through the summer, with the 10-year yield ultimately topping out at 2.98% on September 5. From this point, bonds staged a two-month rally that was fueled in part by the Fed surprising September 18 announcement that it would not in fact taper for the time being.
This bounce proved short-lived, however, as yields again moved higher in November and December as signs of improving growth made a near-term taper more likely. The Fed did in fact announce its first tapering on December 18, when it reduced the size of its quantitative easing program from $85 billion in monthly bond purchases to $75 billion. While the initial reaction in the bond market was muted, the combination of the tapering news — in conjunction with increasingly strong economic reports — drove the yield on the 10-year note over 3% by year-end.
The following table shows the range of yields for Treasury bonds of varying maturities during the course of the year.


